Indegene INDGN full analysis,charts,indicators,moving averages,SMA,DMA,EMA,ADX,MACD,RSIIndegene INDGN WideScreen charts, DMA,SMA,EMA technical analysis, forecast prediction, by indicators ADX,MACD,RSI,CCI NSE stock exchange
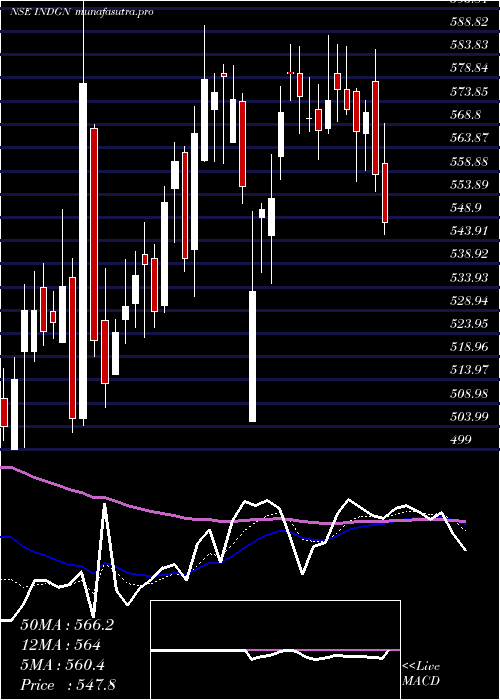
Daily price and charts and targets Indegene Strong Daily Stock price targets for Indegene INDGN are 544.2 and 555.9 | Daily Target 1 | 535.23 | | Daily Target 2 | 541.47 | | Daily Target 3 | 546.93333333333 | | Daily Target 4 | 553.17 | | Daily Target 5 | 558.63 |
Daily price and volume Indegene
| Date |
Closing |
Open |
Range |
Volume |
Tue 28 October 2025 |
547.70 (0.8%) |
541.95 |
540.70 - 552.40 |
0.2758 times |
Mon 27 October 2025 |
543.35 (0.59%) |
542.80 |
538.10 - 545.00 |
0.5731 times |
Fri 24 October 2025 |
540.15 (-1.13%) |
542.00 |
539.00 - 545.00 |
0.3425 times |
Thu 23 October 2025 |
546.35 (-1.51%) |
554.70 |
544.00 - 555.55 |
0.4327 times |
Tue 21 October 2025 |
554.70 (-0.38%) |
559.65 |
552.50 - 559.65 |
0.0801 times |
Mon 20 October 2025 |
556.80 (2.61%) |
542.95 |
533.20 - 562.70 |
5.8906 times |
Fri 17 October 2025 |
542.65 (0.52%) |
543.90 |
537.90 - 546.60 |
0.4742 times |
Thu 16 October 2025 |
539.85 (-0.86%) |
546.00 |
536.85 - 546.05 |
0.2381 times |
Wed 15 October 2025 |
544.55 (2.23%) |
537.00 |
531.00 - 545.00 |
1.2195 times |
Tue 14 October 2025 |
532.65 (-2.86%) |
549.90 |
531.00 - 549.90 |
0.4735 times |
Mon 13 October 2025 |
548.35 (-1.49%) |
554.10 |
545.05 - 557.90 |
0.2735 times |
Weekly price and charts Indegene Strong weekly Stock price targets for Indegene INDGN are 542.9 and 557.2 | Weekly Target 1 | 531.77 | | Weekly Target 2 | 539.73 | | Weekly Target 3 | 546.06666666667 | | Weekly Target 4 | 554.03 | | Weekly Target 5 | 560.37 |
Weekly price and volumes for Indegene
| Date |
Closing |
Open |
Range |
Volume |
Tue 28 October 2025 |
547.70 (1.4%) |
542.80 |
538.10 - 552.40 |
0.2594 times |
Fri 24 October 2025 |
540.15 (-0.46%) |
542.95 |
533.20 - 562.70 |
2.061 times |
Fri 17 October 2025 |
542.65 (-2.52%) |
554.10 |
531.00 - 557.90 |
0.8184 times |
Fri 10 October 2025 |
556.65 (-3.98%) |
585.75 |
540.60 - 585.75 |
1.1164 times |
Fri 03 October 2025 |
579.75 (0.76%) |
575.40 |
558.80 - 587.30 |
0.9388 times |
Fri 26 September 2025 |
575.40 (-1.9%) |
584.00 |
558.95 - 588.70 |
0.7437 times |
Fri 19 September 2025 |
586.55 (2%) |
576.45 |
563.95 - 596.80 |
1.5825 times |
Fri 12 September 2025 |
575.05 (2.43%) |
561.90 |
548.30 - 576.30 |
0.9072 times |
Fri 05 September 2025 |
561.40 (3.52%) |
543.85 |
536.00 - 563.80 |
0.908 times |
Fri 29 August 2025 |
542.30 (-5.28%) |
570.00 |
539.75 - 575.80 |
0.6646 times |
Fri 22 August 2025 |
572.50 (-0.03%) |
579.00 |
568.50 - 593.40 |
1.2967 times |
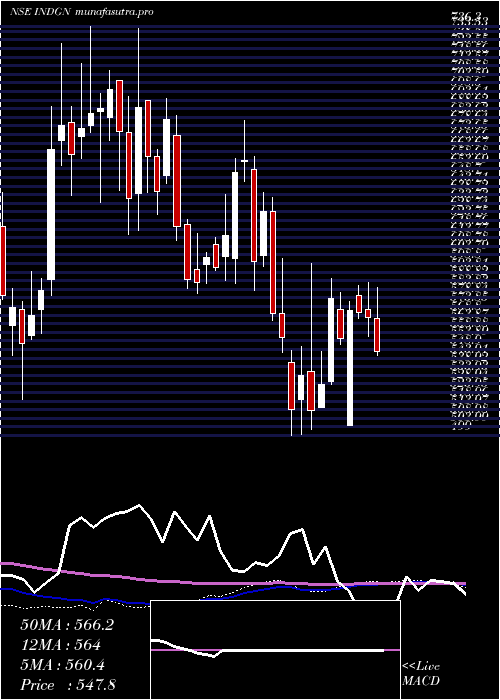
Monthly price and charts Indegene Strong monthly Stock price targets for Indegene INDGN are 511.2 and 567.5 | Monthly Target 1 | 499.03 | | Monthly Target 2 | 523.37 | | Monthly Target 3 | 555.33333333333 | | Monthly Target 4 | 579.67 | | Monthly Target 5 | 611.63 |
Monthly price and volumes Indegene
| Date |
Closing |
Open |
Range |
Volume |
Tue 28 October 2025 |
547.70 (-2.37%) |
562.70 |
531.00 - 587.30 |
0.5086 times |
Tue 30 September 2025 |
561.00 (3.45%) |
543.85 |
536.00 - 596.80 |
0.5211 times |
Fri 29 August 2025 |
542.30 (-0.13%) |
562.95 |
539.75 - 593.40 |
0.8823 times |
Thu 31 July 2025 |
543.00 (-5.51%) |
577.00 |
534.20 - 586.00 |
0.5971 times |
Mon 30 June 2025 |
574.65 (-4.31%) |
599.80 |
564.30 - 632.90 |
4.2458 times |
Fri 30 May 2025 |
600.55 (9.64%) |
556.00 |
529.00 - 622.00 |
0.3196 times |
Wed 30 April 2025 |
547.75 (-5.32%) |
572.00 |
505.00 - 587.95 |
0.3401 times |
Fri 28 March 2025 |
578.50 (12.54%) |
520.00 |
499.45 - 598.70 |
1.2623 times |
Fri 28 February 2025 |
514.05 (-14.28%) |
603.35 |
499.00 - 640.10 |
0.5096 times |
Fri 31 January 2025 |
599.70 (-0.66%) |
605.95 |
583.25 - 681.70 |
0.8135 times |
Tue 31 December 2024 |
603.70 (-11.51%) |
673.00 |
581.25 - 684.75 |
2.475 times |

DMA SMA EMA moving averages of Indegene INDGN
DMA (daily moving average) of Indegene INDGN
| DMA period | DMA value | | 5 day DMA | 546.45 | | 12 day DMA | 546.15 | | 20 day DMA | 553.05 | | 35 day DMA | 561.21 | | 50 day DMA | 561.91 | | 100 day DMA | 567.4 | | 150 day DMA | 569.26 | | 200 day DMA | 573.72 | EMA (exponential moving average) of Indegene INDGN
| EMA period | EMA current | EMA prev | EMA prev2 | | 5 day EMA | 545.99 | 545.13 | 546.02 | | 12 day EMA | 548.49 | 548.63 | 549.59 | | 20 day EMA | 552.25 | 552.73 | 553.72 | | 35 day EMA | 556.29 | 556.8 | 557.59 | | 50 day EMA | 561.28 | 561.83 | 562.58 |
SMA (simple moving average) of Indegene INDGN
| SMA period | SMA current | SMA prev | SMA prev2 | | 5 day SMA | 546.45 | 548.27 | 548.13 | | 12 day SMA | 546.15 | 546.63 | 547.21 | | 20 day SMA | 553.05 | 554.43 | 555.86 | | 35 day SMA | 561.21 | 561.61 | 561.62 | | 50 day SMA | 561.91 | 562.4 | 563.02 | | 100 day SMA | 567.4 | 567.82 | 568.59 | | 150 day SMA | 569.26 | 569.19 | 569.1 | | 200 day SMA | 573.72 | 573.94 | 574.21 |
|
|
