IndbankMerchant INDBANK full analysis,charts,indicators,moving averages,SMA,DMA,EMA,ADX,MACD,RSIIndbank Merchant INDBANK WideScreen charts, DMA,SMA,EMA technical analysis, forecast prediction, by indicators ADX,MACD,RSI,CCI NSE stock exchange
operates under Other Financial Services sector
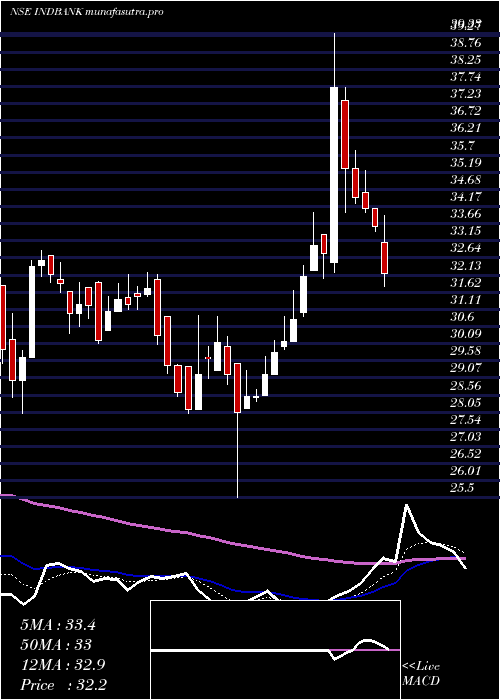
Daily price and charts and targets IndbankMerchant Strong Daily Stock price targets for IndbankMerchant INDBANK are 39.49 and 42.38 | Daily Target 1 | 37.43 | | Daily Target 2 | 38.65 | | Daily Target 3 | 40.323333333333 | | Daily Target 4 | 41.54 | | Daily Target 5 | 43.21 |
Daily price and volume Indbank Merchant
| Date |
Closing |
Open |
Range |
Volume |
Tue 28 October 2025 |
39.86 (1.92%) |
39.11 |
39.11 - 42.00 |
1.0751 times |
Mon 27 October 2025 |
39.11 (-2.83%) |
40.25 |
38.65 - 40.25 |
0.9587 times |
Fri 24 October 2025 |
40.25 (-2.66%) |
41.40 |
40.00 - 41.89 |
0.5003 times |
Thu 23 October 2025 |
41.35 (0.83%) |
41.39 |
41.00 - 42.14 |
1.0151 times |
Tue 21 October 2025 |
41.01 (-2.22%) |
41.94 |
40.62 - 41.94 |
0.3098 times |
Mon 20 October 2025 |
41.94 (2.87%) |
40.77 |
39.04 - 42.74 |
1.7743 times |
Fri 17 October 2025 |
40.77 (-0.78%) |
41.90 |
40.31 - 41.90 |
0.4109 times |
Thu 16 October 2025 |
41.09 (-0.17%) |
41.16 |
40.60 - 42.10 |
0.4611 times |
Wed 15 October 2025 |
41.16 (2.75%) |
40.06 |
39.72 - 41.89 |
1.0531 times |
Tue 14 October 2025 |
40.06 (-6.2%) |
42.00 |
39.41 - 43.40 |
2.4416 times |
Mon 13 October 2025 |
42.71 (-1.66%) |
43.43 |
42.39 - 43.99 |
0.9076 times |
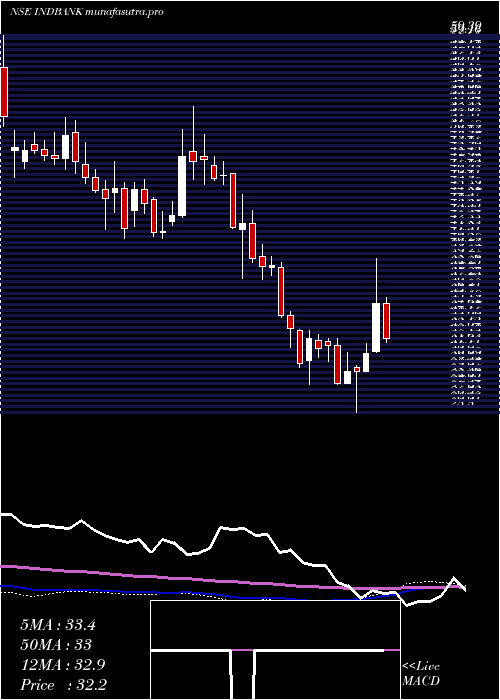
Weekly price and charts IndbankMerchant Strong weekly Stock price targets for IndbankMerchant INDBANK are 37.58 and 40.93 | Weekly Target 1 | 36.82 | | Weekly Target 2 | 38.34 | | Weekly Target 3 | 40.17 | | Weekly Target 4 | 41.69 | | Weekly Target 5 | 43.52 |
Weekly price and volumes for Indbank Merchant
| Date |
Closing |
Open |
Range |
Volume |
Tue 28 October 2025 |
39.86 (-0.97%) |
40.25 |
38.65 - 42.00 |
0.1982 times |
Fri 24 October 2025 |
40.25 (-1.28%) |
40.77 |
39.04 - 42.74 |
0.3507 times |
Fri 17 October 2025 |
40.77 (-6.12%) |
43.43 |
39.41 - 43.99 |
0.5139 times |
Fri 10 October 2025 |
43.43 (31.65%) |
34.10 |
34.10 - 47.15 |
7.102 times |
Fri 03 October 2025 |
32.99 (2.26%) |
32.02 |
32.02 - 33.50 |
0.1256 times |
Fri 26 September 2025 |
32.26 (-3.33%) |
33.99 |
32.10 - 33.99 |
0.2682 times |
Fri 19 September 2025 |
33.37 (2.77%) |
33.00 |
32.46 - 33.80 |
0.1548 times |
Fri 12 September 2025 |
32.47 (0.46%) |
33.15 |
31.50 - 33.69 |
0.2092 times |
Fri 05 September 2025 |
32.32 (-7.47%) |
35.00 |
32.09 - 36.00 |
0.3232 times |
Fri 29 August 2025 |
34.93 (7.34%) |
32.32 |
31.50 - 36.45 |
0.7543 times |
Fri 22 August 2025 |
32.54 (-0.25%) |
33.00 |
31.35 - 33.60 |
0.0887 times |
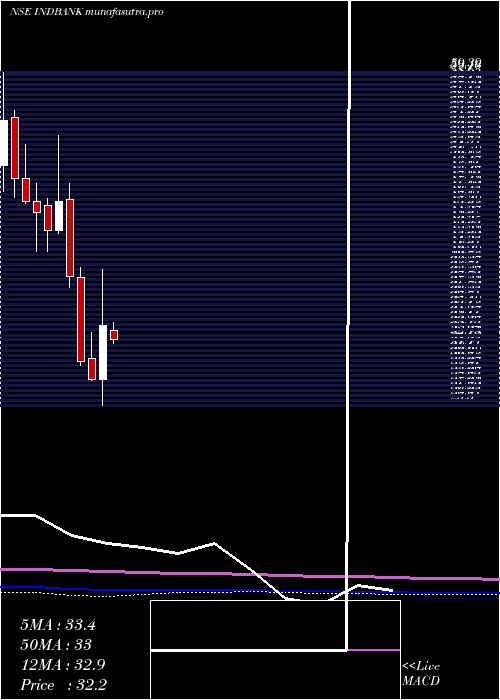
Monthly price and charts IndbankMerchant Strong monthly Stock price targets for IndbankMerchant INDBANK are 36.23 and 50.78 | Monthly Target 1 | 25.32 | | Monthly Target 2 | 32.59 | | Monthly Target 3 | 39.87 | | Monthly Target 4 | 47.14 | | Monthly Target 5 | 54.42 |
Monthly price and volumes Indbank Merchant
| Date |
Closing |
Open |
Range |
Volume |
Tue 28 October 2025 |
39.86 (21.01%) |
33.20 |
32.60 - 47.15 |
4.2305 times |
Tue 30 September 2025 |
32.94 (-5.7%) |
35.00 |
31.50 - 36.00 |
0.5286 times |
Fri 29 August 2025 |
34.93 (5.69%) |
33.38 |
31.35 - 36.45 |
0.5513 times |
Thu 31 July 2025 |
33.05 (-5.14%) |
35.25 |
32.46 - 36.00 |
0.341 times |
Mon 30 June 2025 |
34.84 (-0.09%) |
34.87 |
32.15 - 37.60 |
0.7214 times |
Fri 30 May 2025 |
34.87 (3.84%) |
33.10 |
30.06 - 36.22 |
0.5898 times |
Wed 30 April 2025 |
33.58 (19.42%) |
28.12 |
25.50 - 39.33 |
1.1435 times |
Fri 28 March 2025 |
28.12 (-5.98%) |
30.20 |
28.00 - 32.85 |
0.6405 times |
Fri 28 February 2025 |
29.91 (-22.49%) |
38.52 |
29.50 - 39.48 |
0.355 times |
Fri 31 January 2025 |
38.59 (-16.6%) |
46.49 |
37.50 - 48.05 |
0.8983 times |
Tue 31 December 2024 |
46.27 (6.96%) |
43.26 |
43.00 - 53.00 |
2.067 times |
DMA SMA EMA moving averages of Indbank Merchant INDBANK
DMA (daily moving average) of Indbank Merchant INDBANK
| DMA period | DMA value | | 5 day DMA | 40.32 | | 12 day DMA | 41.06 | | 20 day DMA | 39.61 | | 35 day DMA | 36.61 | | 50 day DMA | 35.67 | | 100 day DMA | 34.99 | | 150 day DMA | 34.1 | | 200 day DMA | 34.64 | EMA (exponential moving average) of Indbank Merchant INDBANK
| EMA period | EMA current | EMA prev | EMA prev2 | | 5 day EMA | 40.17 | 40.32 | 40.92 | | 12 day EMA | 40.16 | 40.22 | 40.42 | | 20 day EMA | 39.3 | 39.24 | 39.25 | | 35 day EMA | 37.8 | 37.68 | 37.6 | | 50 day EMA | 35.84 | 35.68 | 35.54 |
SMA (simple moving average) of Indbank Merchant INDBANK
| SMA period | SMA current | SMA prev | SMA prev2 | | 5 day SMA | 40.32 | 40.73 | 41.06 | | 12 day SMA | 41.06 | 41.13 | 41.36 | | 20 day SMA | 39.61 | 39.23 | 38.9 | | 35 day SMA | 36.61 | 36.39 | 36.25 | | 50 day SMA | 35.67 | 35.52 | 35.39 | | 100 day SMA | 34.99 | 34.94 | 34.9 | | 150 day SMA | 34.1 | 34.04 | 33.99 | | 200 day SMA | 34.64 | 34.66 | 34.7 |
|
|
