SecRe IMC1_N0 full analysis,charts,indicators,moving averages,SMA,DMA,EMA,ADX,MACD,RSISec Re IMC1_N0 WideScreen charts, DMA,SMA,EMA technical analysis, forecast prediction, by indicators ADX,MACD,RSI,CCI NSE stock exchange
Daily price and charts and targets SecRe Strong Daily Stock price targets for SecRe IMC1_N0 are 253.25 and 253.75 | Daily Target 1 | 252.83 | | Daily Target 2 | 253.17 | | Daily Target 3 | 253.33333333333 | | Daily Target 4 | 253.67 | | Daily Target 5 | 253.83 |
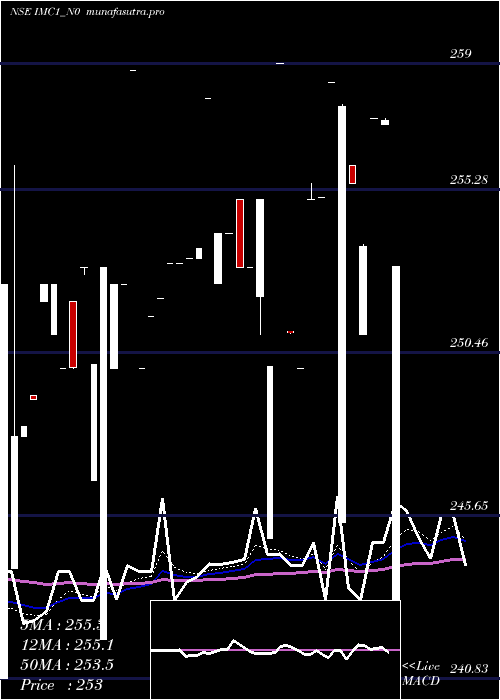
Daily price and volume Sec Re
| Date |
Closing |
Open |
Range |
Volume |
Fri 24 October 2025 |
253.50 (1.4%) |
253.00 |
253.00 - 253.50 |
0.702 times |
Mon 20 October 2025 |
250.00 (1.42%) |
250.00 |
250.00 - 250.00 |
0.3295 times |
Fri 17 October 2025 |
246.50 (0.17%) |
246.50 |
246.50 - 246.50 |
0.1433 times |
Thu 16 October 2025 |
246.09 (-1.56%) |
246.55 |
246.05 - 246.55 |
0.2579 times |
Wed 15 October 2025 |
250.00 (0%) |
250.00 |
250.00 - 250.00 |
0.0287 times |
Mon 13 October 2025 |
250.00 (-0.4%) |
251.00 |
250.00 - 251.00 |
4.1117 times |
Fri 10 October 2025 |
251.00 (-0.97%) |
250.00 |
250.00 - 251.00 |
2.3496 times |
Wed 08 October 2025 |
253.45 (4.73%) |
243.00 |
243.00 - 253.45 |
1.2178 times |
Mon 06 October 2025 |
242.00 (-1.43%) |
240.59 |
240.59 - 242.00 |
0.7163 times |
Fri 26 September 2025 |
245.50 (0%) |
245.50 |
245.50 - 245.50 |
0.1433 times |
Thu 25 September 2025 |
245.50 (-2.75%) |
249.93 |
245.50 - 250.00 |
3.1089 times |
Weekly price and charts SecRe Strong weekly Stock price targets for SecRe IMC1_N0 are 251.75 and 255.25 | Weekly Target 1 | 248.83 | | Weekly Target 2 | 251.17 | | Weekly Target 3 | 252.33333333333 | | Weekly Target 4 | 254.67 | | Weekly Target 5 | 255.83 |
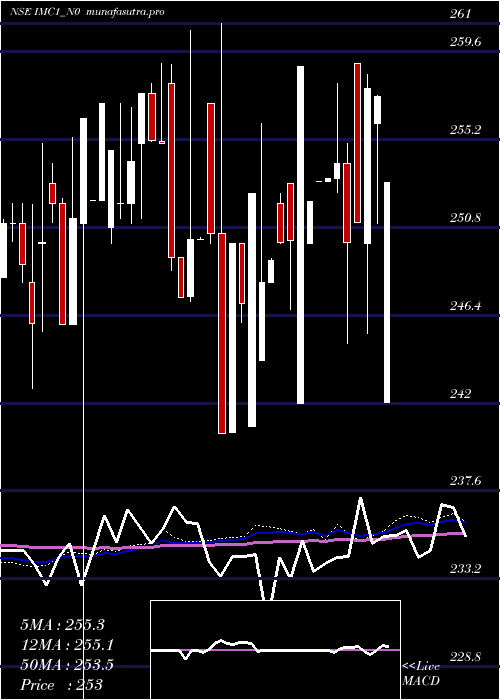
Weekly price and volumes for Sec Re
| Date |
Closing |
Open |
Range |
Volume |
Fri 24 October 2025 |
253.50 (2.84%) |
250.00 |
250.00 - 253.50 |
0.277 times |
Fri 17 October 2025 |
246.50 (-1.79%) |
251.00 |
246.05 - 251.00 |
1.2197 times |
Fri 10 October 2025 |
251.00 (2.24%) |
240.59 |
240.59 - 253.45 |
1.1504 times |
Fri 26 September 2025 |
245.50 (-1.41%) |
249.00 |
245.50 - 252.45 |
1.9623 times |
Wed 17 September 2025 |
249.00 (0.79%) |
249.00 |
249.00 - 252.50 |
0.5694 times |
Fri 12 September 2025 |
247.05 (-3.11%) |
241.41 |
241.41 - 254.00 |
0.1231 times |
Fri 05 September 2025 |
254.97 (0.38%) |
254.00 |
254.00 - 254.97 |
0.7503 times |
Fri 29 August 2025 |
254.00 (1.2%) |
254.00 |
252.00 - 255.00 |
1.4121 times |
Fri 22 August 2025 |
251.00 (0.78%) |
252.00 |
248.00 - 252.00 |
1.1966 times |
Thu 14 August 2025 |
249.05 (-3.09%) |
241.01 |
241.01 - 258.96 |
1.339 times |
Tue 05 August 2025 |
257.00 (0%) |
249.40 |
249.40 - 257.00 |
0.504 times |
Monthly price and charts SecRe Strong monthly Stock price targets for SecRe IMC1_N0 are 247.05 and 259.96 | Monthly Target 1 | 236.29 | | Monthly Target 2 | 244.89 | | Monthly Target 3 | 249.19666666667 | | Monthly Target 4 | 257.8 | | Monthly Target 5 | 262.11 |
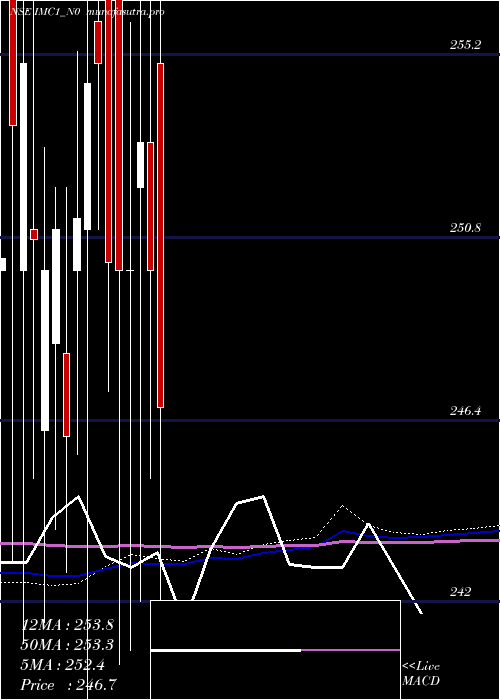
Monthly price and volumes Sec Re
| Date |
Closing |
Open |
Range |
Volume |
Fri 24 October 2025 |
253.50 (3.26%) |
240.59 |
240.59 - 253.50 |
0.3228 times |
Fri 26 September 2025 |
245.50 (-3.35%) |
254.00 |
241.41 - 254.97 |
0.4152 times |
Fri 29 August 2025 |
254.00 (-1.17%) |
249.40 |
241.01 - 258.96 |
0.5428 times |
Wed 30 July 2025 |
257.00 (2.8%) |
255.00 |
242.03 - 258.45 |
1.0354 times |
Mon 30 June 2025 |
250.00 (-1.22%) |
253.10 |
245.00 - 259.00 |
0.8294 times |
Thu 29 May 2025 |
253.10 (1.24%) |
252.00 |
242.00 - 258.82 |
0.5667 times |
Wed 30 April 2025 |
250.00 (0%) |
250.00 |
240.83 - 255.99 |
1.0269 times |
Fri 28 March 2025 |
250.00 (-0.08%) |
257.00 |
240.50 - 261.00 |
2.5774 times |
Thu 27 February 2025 |
250.20 (-1.88%) |
258.00 |
247.10 - 260.65 |
0.782 times |
Thu 30 January 2025 |
255.00 (0.2%) |
256.00 |
251.00 - 259.00 |
1.9014 times |
Tue 31 December 2024 |
254.50 (1.29%) |
251.00 |
220.00 - 257.00 |
0.6361 times |
DMA SMA EMA moving averages of Sec Re IMC1_N0
DMA (daily moving average) of Sec Re IMC1_N0
| DMA period | DMA value | | 5 day DMA | 249.22 | | 12 day DMA | 248.83 | | 20 day DMA | 250.15 | | 35 day DMA | 251.73 | | 50 day DMA | 252.41 | | 100 day DMA | 252.18 | | 150 day DMA | 252.38 | | 200 day DMA | 251.57 | EMA (exponential moving average) of Sec Re IMC1_N0
| EMA period | EMA current | EMA prev | EMA prev2 | | 5 day EMA | 250.21 | 248.57 | 247.85 | | 12 day EMA | 249.73 | 249.04 | 248.87 | | 20 day EMA | 250.15 | 249.8 | 249.78 | | 35 day EMA | 251.1 | 250.96 | 251.02 | | 50 day EMA | 252.22 | 252.17 | 252.26 |
SMA (simple moving average) of Sec Re IMC1_N0
| SMA period | SMA current | SMA prev | SMA prev2 | | 5 day SMA | 249.22 | 248.52 | 248.72 | | 12 day SMA | 248.83 | 248.71 | 248.62 | | 20 day SMA | 250.15 | 250.23 | 250.33 | | 35 day SMA | 251.73 | 251.64 | 251.54 | | 50 day SMA | 252.41 | 252.44 | 252.5 | | 100 day SMA | 252.18 | 252.19 | 252.24 | | 150 day SMA | 252.38 | 252.36 | 252.37 | | 200 day SMA | 251.57 | 251.57 | 251.57 |
|
|
