IndustrialInv IITL_BE full analysis,charts,indicators,moving averages,SMA,DMA,EMA,ADX,MACD,RSIIndustrial Inv IITL_BE WideScreen charts, DMA,SMA,EMA technical analysis, forecast prediction, by indicators ADX,MACD,RSI,CCI NSE stock exchange
Daily price and charts and targets IndustrialInv Strong Daily Stock price targets for IndustrialInv IITL_BE are 166.41 and 170.41 | Daily Target 1 | 165.26 | | Daily Target 2 | 167.56 | | Daily Target 3 | 169.25666666667 | | Daily Target 4 | 171.56 | | Daily Target 5 | 173.26 |
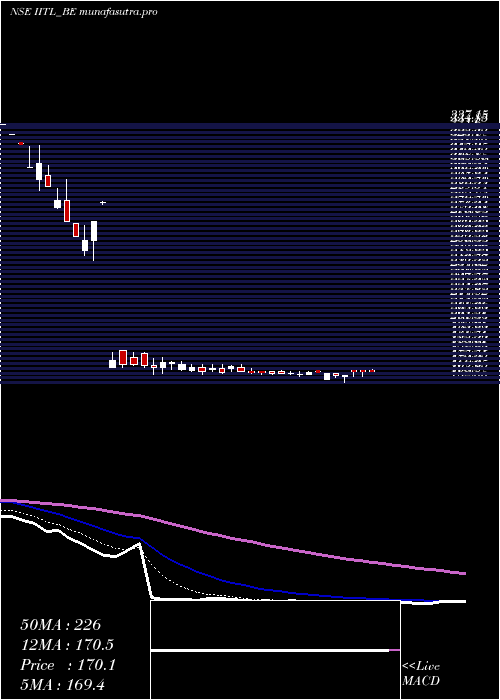
Daily price and volume Industrial Inv
| Date |
Closing |
Open |
Range |
Volume |
Tue 15 July 2025 |
169.87 (0.06%) |
170.95 |
166.95 - 170.95 |
0.2217 times |
Mon 14 July 2025 |
169.76 (1.59%) |
171.00 |
166.60 - 171.00 |
0.9631 times |
Fri 11 July 2025 |
167.10 (0%) |
167.00 |
162.55 - 167.10 |
0.5079 times |
Thu 10 July 2025 |
167.10 (-1.09%) |
169.00 |
166.02 - 169.00 |
0.1589 times |
Wed 09 July 2025 |
168.95 (-0.59%) |
165.00 |
165.00 - 169.00 |
0.7517 times |
Tue 08 July 2025 |
169.95 (0.52%) |
170.00 |
169.10 - 170.00 |
0.2733 times |
Mon 07 July 2025 |
169.07 (0.43%) |
168.35 |
168.35 - 170.02 |
0.4307 times |
Fri 04 July 2025 |
168.35 (-0.16%) |
168.02 |
167.00 - 170.00 |
0.561 times |
Thu 03 July 2025 |
168.62 (-0.21%) |
168.50 |
168.02 - 170.00 |
0.6408 times |
Wed 02 July 2025 |
168.98 (0.18%) |
170.00 |
168.60 - 171.00 |
5.491 times |
Tue 01 July 2025 |
168.67 (-0.43%) |
170.01 |
168.40 - 170.01 |
5.0246 times |
Weekly price and charts IndustrialInv Strong weekly Stock price targets for IndustrialInv IITL_BE are 166.04 and 170.44 | Weekly Target 1 | 164.76 | | Weekly Target 2 | 167.31 | | Weekly Target 3 | 169.15666666667 | | Weekly Target 4 | 171.71 | | Weekly Target 5 | 173.56 |
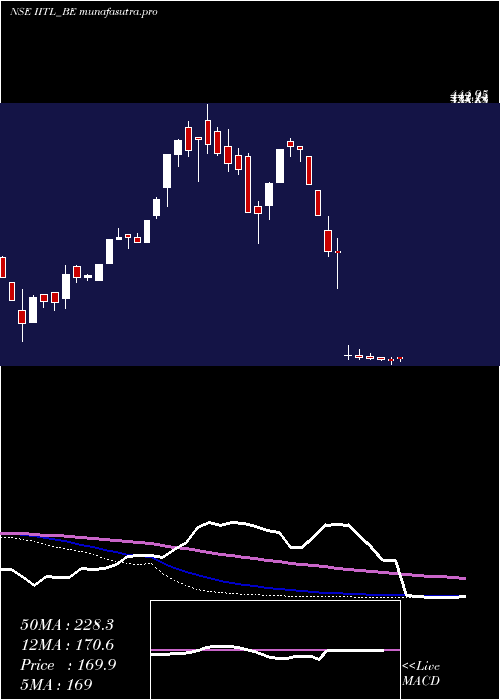
Weekly price and volumes for Industrial Inv
| Date |
Closing |
Open |
Range |
Volume |
Tue 15 July 2025 |
169.87 (1.66%) |
171.00 |
166.60 - 171.00 |
0.0342 times |
Fri 11 July 2025 |
167.10 (-0.74%) |
168.35 |
162.55 - 170.02 |
0.0613 times |
Fri 04 July 2025 |
168.35 (-0.71%) |
170.40 |
167.00 - 171.00 |
1.0954 times |
Fri 27 June 2025 |
169.56 (-0.47%) |
171.21 |
168.55 - 175.00 |
1.4199 times |
Fri 20 June 2025 |
170.36 (-1.53%) |
173.00 |
168.00 - 179.50 |
3.9262 times |
Fri 13 June 2025 |
173.00 (-39.17%) |
173.00 |
168.00 - 184.00 |
2.9159 times |
Fri 07 March 2025 |
284.40 (-0.37%) |
285.45 |
245.35 - 299.70 |
0.1542 times |
Fri 28 February 2025 |
285.45 (-11.84%) |
307.65 |
280.35 - 323.00 |
0.3767 times |
Fri 21 February 2025 |
323.80 (-9.59%) |
351.00 |
323.80 - 351.00 |
0.0054 times |
Fri 14 February 2025 |
358.15 (-9.54%) |
388.00 |
358.15 - 388.05 |
0.0108 times |
Fri 07 February 2025 |
395.90 (-0.9%) |
399.00 |
382.95 - 399.00 |
0.1106 times |
Monthly price and charts IndustrialInv Strong monthly Stock price targets for IndustrialInv IITL_BE are 161.99 and 170.44 | Monthly Target 1 | 159.36 | | Monthly Target 2 | 164.61 | | Monthly Target 3 | 167.80666666667 | | Monthly Target 4 | 173.06 | | Monthly Target 5 | 176.26 |
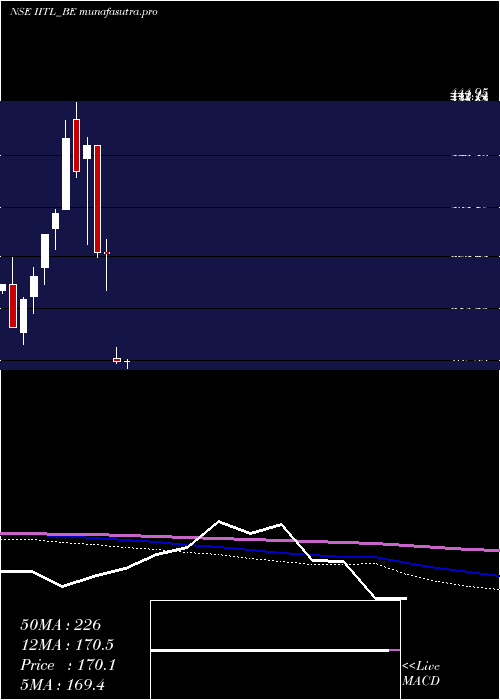
Monthly price and volumes Industrial Inv
| Date |
Closing |
Open |
Range |
Volume |
Tue 15 July 2025 |
169.87 (0.28%) |
170.01 |
162.55 - 171.00 |
0.1524 times |
Mon 30 June 2025 |
169.40 (-40.44%) |
173.00 |
168.00 - 184.00 |
3.1663 times |
Fri 07 March 2025 |
284.40 (-0.37%) |
285.45 |
245.35 - 299.70 |
0.0541 times |
Fri 28 February 2025 |
285.45 (-28.55%) |
399.00 |
280.35 - 399.00 |
0.1768 times |
Fri 31 January 2025 |
399.50 (7.51%) |
385.00 |
293.95 - 407.85 |
1.1856 times |
Tue 31 December 2024 |
371.60 (-8.65%) |
427.10 |
365.50 - 444.95 |
0.5411 times |
Fri 29 November 2024 |
406.80 (24.4%) |
331.00 |
331.00 - 425.75 |
0.8887 times |
Thu 31 October 2024 |
327.00 (7.39%) |
310.50 |
289.10 - 330.80 |
0.245 times |
Mon 30 September 2024 |
304.50 (16.93%) |
269.00 |
251.50 - 304.50 |
1.374 times |
Fri 30 August 2024 |
260.41 (10.37%) |
239.00 |
221.01 - 270.00 |
2.216 times |
Thu 07 March 2024 |
235.95 (14.87%) |
200.40 |
188.05 - 237.95 |
0.3933 times |
DMA SMA EMA moving averages of Industrial Inv IITL_BE
DMA (daily moving average) of Industrial Inv IITL_BE
| DMA period | DMA value | | 5 day DMA | 168.56 | | 12 day DMA | 168.82 | | 20 day DMA | 169.91 | | 35 day DMA | 196.07 | | 50 day DMA | 245.98 | | 100 day DMA | 311.77 | | 150 day DMA | 314.2 | | 200 day DMA | 296.9 | EMA (exponential moving average) of Industrial Inv IITL_BE
| EMA period | EMA current | EMA prev | EMA prev2 | | 5 day EMA | 169.03 | 168.61 | 168.03 | | 12 day EMA | 170.61 | 170.75 | 170.93 | | 20 day EMA | 179.8 | 180.85 | 182.02 | | 35 day EMA | 214.74 | 217.38 | 220.18 | | 50 day EMA | 250.94 | 254.25 | 257.7 |
SMA (simple moving average) of Industrial Inv IITL_BE
| SMA period | SMA current | SMA prev | SMA prev2 | | 5 day SMA | 168.56 | 168.57 | 168.43 | | 12 day SMA | 168.82 | 168.79 | 168.84 | | 20 day SMA | 169.91 | 170.22 | 170.53 | | 35 day SMA | 196.07 | 200 | 204.4 | | 50 day SMA | 245.98 | 250.55 | 255.14 | | 100 day SMA | 311.77 | 314.02 | 316.35 | | 150 day SMA | 314.2 | 314.77 | 315.37 | | 200 day SMA | 296.9 | 297.29 | 297.68 |
|
|
