SecRe IIFLZC26B_NY full analysis,charts,indicators,moving averages,SMA,DMA,EMA,ADX,MACD,RSISec Re IIFLZC26B_NY WideScreen charts, DMA,SMA,EMA technical analysis, forecast prediction, by indicators ADX,MACD,RSI,CCI NSE stock exchange
Daily price and charts and targets SecRe Strong Daily Stock price targets for SecRe IIFLZC26B_NY are 1211.85 and 1211.85 | Daily Target 1 | 1211.85 | | Daily Target 2 | 1211.85 | | Daily Target 3 | 1211.85 | | Daily Target 4 | 1211.85 | | Daily Target 5 | 1211.85 |
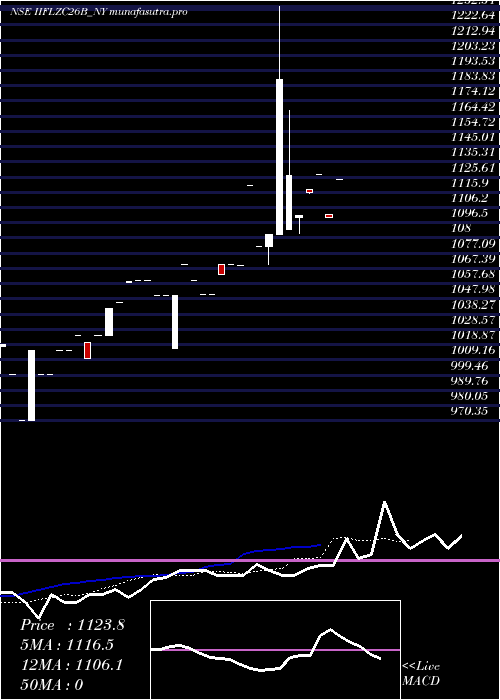
Daily price and volume Sec Re
| Date |
Closing |
Open |
Range |
Volume |
Tue 09 December 2025 |
1211.85 (0.26%) |
1211.85 |
1211.85 - 1211.85 |
0.1724 times |
Mon 08 December 2025 |
1208.75 (0.49%) |
1208.75 |
1208.75 - 1208.75 |
0.069 times |
Fri 05 December 2025 |
1202.82 (0.98%) |
1202.82 |
1202.82 - 1202.82 |
0.3448 times |
Thu 04 December 2025 |
1191.20 (-0.32%) |
1208.85 |
1191.20 - 1208.85 |
4.6207 times |
Mon 01 December 2025 |
1195.00 (-0.86%) |
1195.00 |
1195.00 - 1195.00 |
3.4483 times |
Fri 14 November 2025 |
1205.35 (0.17%) |
1205.35 |
1205.35 - 1205.35 |
0.1724 times |
Thu 13 November 2025 |
1203.35 (0.43%) |
1191.99 |
1191.99 - 1203.35 |
0.7241 times |
Fri 07 November 2025 |
1198.15 (0%) |
1198.15 |
1198.15 - 1198.15 |
0.2414 times |
Wed 29 October 2025 |
1198.15 (0.25%) |
1198.15 |
1198.15 - 1198.15 |
0.1724 times |
Tue 21 October 2025 |
1195.15 (1.8%) |
1195.15 |
1195.15 - 1195.15 |
0.0345 times |
Tue 30 September 2025 |
1174.00 (-0.05%) |
1174.00 |
1174.00 - 1174.00 |
0.8621 times |
Weekly price and charts SecRe Strong weekly Stock price targets for SecRe IIFLZC26B_NY are 1210.3 and 1213.4 | Weekly Target 1 | 1207.72 | | Weekly Target 2 | 1209.78 | | Weekly Target 3 | 1210.8166666667 | | Weekly Target 4 | 1212.88 | | Weekly Target 5 | 1213.92 |
Weekly price and volumes for Sec Re
| Date |
Closing |
Open |
Range |
Volume |
Tue 09 December 2025 |
1211.85 (0.75%) |
1208.75 |
1208.75 - 1211.85 |
0.1116 times |
Fri 05 December 2025 |
1202.82 (-0.21%) |
1195.00 |
1191.20 - 1208.85 |
3.8915 times |
Fri 14 November 2025 |
1205.35 (0.6%) |
1191.99 |
1191.99 - 1205.35 |
0.4147 times |
Fri 07 November 2025 |
1198.15 (2.06%) |
1195.15 |
1195.15 - 1198.15 |
0.2073 times |
Tue 30 September 2025 |
1174.00 (-0.05%) |
1174.00 |
1174.00 - 1174.00 |
0.3987 times |
Wed 24 September 2025 |
1174.55 (0.39%) |
1171.00 |
1171.00 - 1194.15 |
1.1802 times |
Fri 19 September 2025 |
1170.00 (0.21%) |
1185.15 |
1170.00 - 1186.15 |
1.2281 times |
Wed 20 August 2025 |
1167.50 (1.17%) |
1167.50 |
1167.50 - 1167.50 |
0.5582 times |
Thu 14 August 2025 |
1154.00 (-1.24%) |
1168.50 |
1154.00 - 1168.50 |
0.5104 times |
Thu 07 August 2025 |
1168.50 (1.5%) |
1168.50 |
1168.50 - 1168.50 |
1.4992 times |
Fri 01 August 2025 |
1151.20 (-1.62%) |
1151.30 |
1151.20 - 1151.30 |
3.9872 times |

Monthly price and charts SecRe Strong monthly Stock price targets for SecRe IIFLZC26B_NY are 1201.53 and 1222.18 | Monthly Target 1 | 1184.32 | | Monthly Target 2 | 1198.08 | | Monthly Target 3 | 1204.9666666667 | | Monthly Target 4 | 1218.73 | | Monthly Target 5 | 1225.62 |
Monthly price and volumes Sec Re
| Date |
Closing |
Open |
Range |
Volume |
Tue 09 December 2025 |
1211.85 (0.54%) |
1195.00 |
1191.20 - 1211.85 |
0.6005 times |
Fri 14 November 2025 |
1205.35 (0.6%) |
1198.15 |
1191.99 - 1205.35 |
0.0789 times |
Wed 29 October 2025 |
1198.15 (2.06%) |
1195.15 |
1195.15 - 1198.15 |
0.0144 times |
Tue 30 September 2025 |
1174.00 (0.56%) |
1185.15 |
1170.00 - 1194.15 |
0.4211 times |
Wed 20 August 2025 |
1167.50 (-0.23%) |
1151.30 |
1151.20 - 1168.50 |
0.9833 times |
Fri 25 July 2025 |
1170.20 (2.92%) |
1166.25 |
1142.10 - 1172.85 |
0.2321 times |
Mon 30 June 2025 |
1137.00 (0.73%) |
1128.80 |
1125.20 - 1156.65 |
1.0048 times |
Thu 29 May 2025 |
1128.80 (0.44%) |
1123.00 |
1123.00 - 1128.80 |
0.7177 times |
Wed 30 April 2025 |
1123.80 (-0.24%) |
1100.00 |
1090.00 - 1127.55 |
3.866 times |
Wed 26 March 2025 |
1126.50 (4.16%) |
1081.20 |
1070.00 - 1234.00 |
2.0813 times |
Mon 24 February 2025 |
1081.50 (2.9%) |
1070.10 |
1063.65 - 1120.00 |
0.689 times |

DMA SMA EMA moving averages of Sec Re IIFLZC26B_NY
DMA (daily moving average) of Sec Re IIFLZC26B_NY
| DMA period | DMA value | | 5 day DMA | 1201.92 | | 12 day DMA | 1196.53 | | 20 day DMA | 1186.23 | | 35 day DMA | 1174.28 | | 50 day DMA | 1159.24 | | 100 day DMA | | | 150 day DMA | | | 200 day DMA | | EMA (exponential moving average) of Sec Re IIFLZC26B_NY
| EMA period | EMA current | EMA prev | EMA prev2 | | 5 day EMA | 1204.89 | 1201.41 | 1197.74 | | 12 day EMA | 1196.72 | 1193.97 | 1191.28 | | 20 day EMA | 1188.13 | 1185.63 | 1183.2 | | 35 day EMA | 1172.09 | 1169.75 | 1167.45 | | 50 day EMA | 1156.63 | 1154.38 | 1152.16 |
SMA (simple moving average) of Sec Re IIFLZC26B_NY
| SMA period | SMA current | SMA prev | SMA prev2 | | 5 day SMA | 1201.92 | 1200.62 | 1199.54 | | 12 day SMA | 1196.53 | 1193.12 | 1189.89 | | 20 day SMA | 1186.23 | 1184.06 | 1182.05 | | 35 day SMA | 1174.28 | 1172.09 | 1169.7 | | 50 day SMA | 1159.24 | 1157.4 | 1154.6 | | 100 day SMA | | 150 day SMA | | 200 day SMA |
|
|
