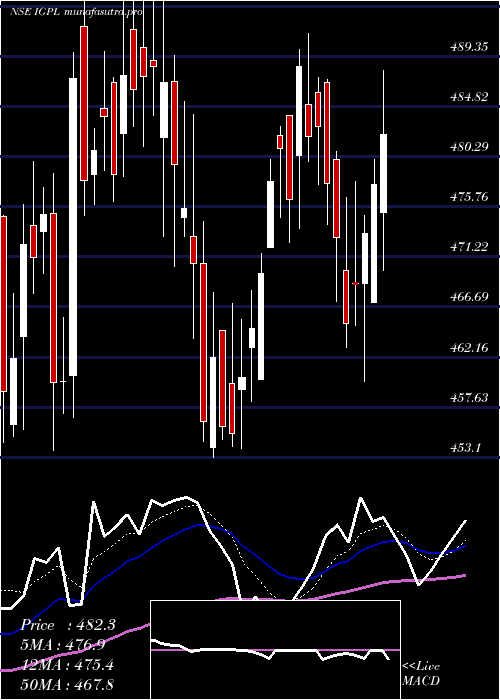
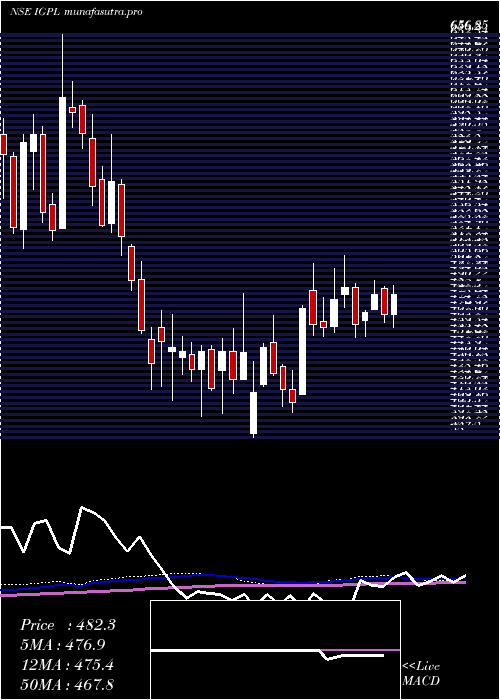
IgPetrochemicals IGPL full analysis,charts,indicators,moving averages,SMA,DMA,EMA,ADX,MACD,RSIIg Petrochemicals IGPL WideScreen charts, DMA,SMA,EMA technical analysis, forecast prediction, by indicators ADX,MACD,RSI,CCI NSE stock exchange
operates under Commodity Chemicals sector
Daily price and charts and targets IgPetrochemicals Strong Daily Stock price targets for IgPetrochemicals IGPL are 408.48 and 418.48 | Daily Target 1 | 405.65 | | Daily Target 2 | 411.3 | | Daily Target 3 | 415.65 | | Daily Target 4 | 421.3 | | Daily Target 5 | 425.65 |
Daily price and volume Ig Petrochemicals
| Date |
Closing |
Open |
Range |
Volume |
Wed 29 October 2025 |
416.95 (-0.02%) |
417.05 |
410.00 - 420.00 |
1.0662 times |
Tue 28 October 2025 |
417.05 (0.42%) |
416.95 |
405.00 - 418.05 |
2.3628 times |
Mon 27 October 2025 |
415.30 (-1.6%) |
425.40 |
413.00 - 425.40 |
0.9514 times |
Fri 24 October 2025 |
422.05 (-0.18%) |
425.30 |
414.00 - 425.30 |
0.5178 times |
Thu 23 October 2025 |
422.80 (1.49%) |
416.60 |
416.60 - 425.00 |
1.0689 times |
Tue 21 October 2025 |
416.60 (0.49%) |
416.00 |
412.00 - 419.00 |
0.2747 times |
Mon 20 October 2025 |
414.55 (0.06%) |
416.75 |
411.50 - 419.00 |
0.8966 times |
Fri 17 October 2025 |
414.30 (-0.38%) |
415.90 |
411.50 - 419.20 |
0.9819 times |
Thu 16 October 2025 |
415.90 (-0.85%) |
422.90 |
414.60 - 422.90 |
0.6619 times |
Wed 15 October 2025 |
419.45 (1.66%) |
412.60 |
412.60 - 425.00 |
1.2178 times |
Tue 14 October 2025 |
412.60 (-0.88%) |
418.70 |
411.10 - 423.50 |
2.6404 times |
Weekly price and charts IgPetrochemicals Strong weekly Stock price targets for IgPetrochemicals IGPL are 400.78 and 421.18 | Weekly Target 1 | 395.38 | | Weekly Target 2 | 406.17 | | Weekly Target 3 | 415.78333333333 | | Weekly Target 4 | 426.57 | | Weekly Target 5 | 436.18 |
Weekly price and volumes for Ig Petrochemicals
| Date |
Closing |
Open |
Range |
Volume |
Wed 29 October 2025 |
416.95 (-1.21%) |
425.40 |
405.00 - 425.40 |
0.8227 times |
Fri 24 October 2025 |
422.05 (1.87%) |
416.75 |
411.50 - 425.30 |
0.518 times |
Fri 17 October 2025 |
414.30 (-3.42%) |
428.70 |
411.10 - 428.95 |
1.4212 times |
Fri 10 October 2025 |
428.95 (0.61%) |
426.35 |
423.00 - 431.90 |
2.0222 times |
Fri 03 October 2025 |
426.35 (1.99%) |
418.05 |
414.85 - 430.15 |
0.5703 times |
Fri 26 September 2025 |
418.05 (-4.67%) |
439.45 |
415.60 - 441.85 |
1.3686 times |
Fri 19 September 2025 |
438.55 (0.97%) |
434.30 |
431.70 - 444.35 |
1.0162 times |
Fri 12 September 2025 |
434.35 (-1.31%) |
441.85 |
428.50 - 447.90 |
0.952 times |
Fri 05 September 2025 |
440.10 (2.64%) |
428.80 |
428.80 - 448.00 |
0.5568 times |
Fri 29 August 2025 |
428.80 (-7.5%) |
467.25 |
426.20 - 467.25 |
0.7519 times |
Fri 22 August 2025 |
463.55 (9.46%) |
426.00 |
419.90 - 472.00 |
2.5012 times |
Monthly price and charts IgPetrochemicals Strong monthly Stock price targets for IgPetrochemicals IGPL are 397.53 and 424.43 | Monthly Target 1 | 391.05 | | Monthly Target 2 | 404 | | Monthly Target 3 | 417.95 | | Monthly Target 4 | 430.9 | | Monthly Target 5 | 444.85 |
Monthly price and volumes Ig Petrochemicals
| Date |
Closing |
Open |
Range |
Volume |
Wed 29 October 2025 |
416.95 (-0.81%) |
418.00 |
405.00 - 431.90 |
0.5341 times |
Tue 30 September 2025 |
420.35 (-1.97%) |
428.80 |
414.85 - 448.00 |
0.4424 times |
Fri 29 August 2025 |
428.80 (-11.19%) |
482.85 |
419.90 - 488.00 |
0.7426 times |
Thu 31 July 2025 |
482.85 (1%) |
482.20 |
460.00 - 519.80 |
1.2001 times |
Mon 30 June 2025 |
478.05 (3.92%) |
460.50 |
453.10 - 507.95 |
1.2159 times |
Fri 30 May 2025 |
460.00 (12.65%) |
408.35 |
403.00 - 503.00 |
1.3438 times |
Wed 30 April 2025 |
408.35 (-3.95%) |
425.15 |
386.00 - 482.65 |
0.9675 times |
Fri 28 March 2025 |
425.15 (-1.53%) |
431.75 |
400.00 - 459.05 |
1.4561 times |
Fri 28 February 2025 |
431.75 (-0.87%) |
460.00 |
410.60 - 471.50 |
1.1855 times |
Fri 31 January 2025 |
435.55 (-22.15%) |
560.00 |
418.50 - 589.20 |
0.912 times |
Tue 31 December 2024 |
559.45 (-8.88%) |
607.50 |
523.65 - 624.70 |
0.8046 times |
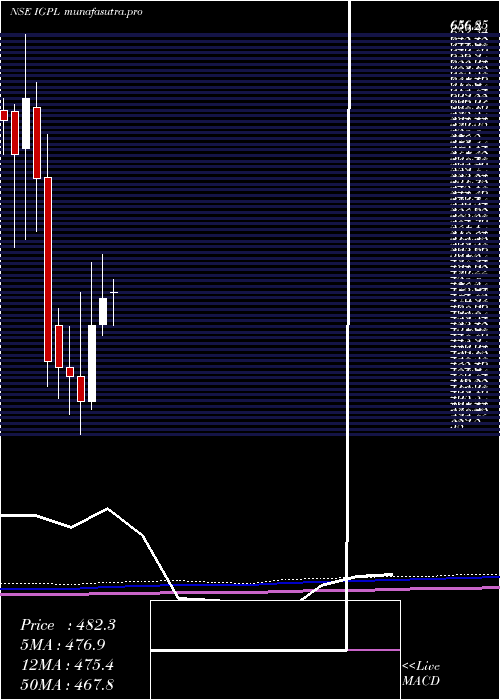
DMA SMA EMA moving averages of Ig Petrochemicals IGPL
DMA (daily moving average) of Ig Petrochemicals IGPL
| DMA period | DMA value | | 5 day DMA | 418.83 | | 12 day DMA | 416.98 | | 20 day DMA | 420.31 | | 35 day DMA | 425.27 | | 50 day DMA | 429.7 | | 100 day DMA | 451.96 | | 150 day DMA | 449.39 | | 200 day DMA | 449.15 | EMA (exponential moving average) of Ig Petrochemicals IGPL
| EMA period | EMA current | EMA prev | EMA prev2 | | 5 day EMA | 417.53 | 417.82 | 418.21 | | 12 day EMA | 418.61 | 418.91 | 419.25 | | 20 day EMA | 420.56 | 420.94 | 421.35 | | 35 day EMA | 424.82 | 425.28 | 425.76 | | 50 day EMA | 429.34 | 429.85 | 430.37 |
SMA (simple moving average) of Ig Petrochemicals IGPL
| SMA period | SMA current | SMA prev | SMA prev2 | | 5 day SMA | 418.83 | 418.76 | 418.26 | | 12 day SMA | 416.98 | 417.98 | 418.69 | | 20 day SMA | 420.31 | 420.27 | 420.32 | | 35 day SMA | 425.27 | 425.94 | 426.6 | | 50 day SMA | 429.7 | 429.83 | 430 | | 100 day SMA | 451.96 | 452.63 | 453.27 | | 150 day SMA | 449.39 | 449.54 | 449.56 | | 200 day SMA | 449.15 | 449.72 | 450.35 |
|
|
