Ifci IFCI full analysis,charts,indicators,moving averages,SMA,DMA,EMA,ADX,MACD,RSIIfci IFCI WideScreen charts, DMA,SMA,EMA technical analysis, forecast prediction, by indicators ADX,MACD,RSI,CCI NSE stock exchange
operates under Financial Institutions sector
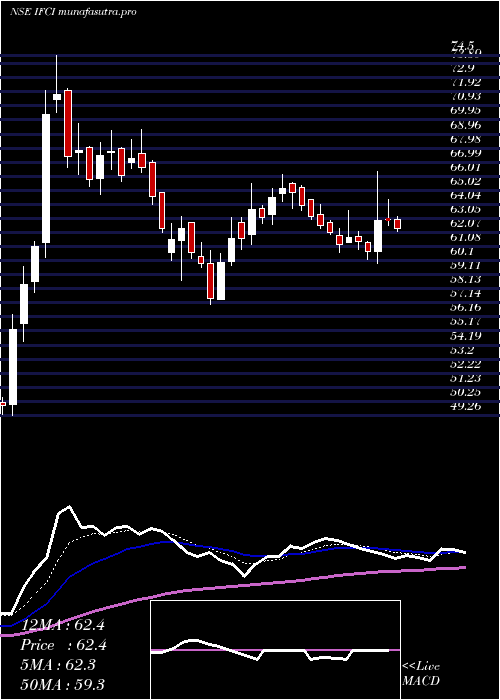
Daily price and charts and targets Ifci Strong Daily Stock price targets for Ifci IFCI are 56.54 and 57.99 | Daily Target 1 | 55.39 | | Daily Target 2 | 56.23 | | Daily Target 3 | 56.84 | | Daily Target 4 | 57.68 | | Daily Target 5 | 58.29 |
Daily price and volume Ifci
| Date |
Closing |
Open |
Range |
Volume |
Wed 29 October 2025 |
57.07 (1.24%) |
56.89 |
56.00 - 57.45 |
1.5431 times |
Tue 28 October 2025 |
56.37 (0.7%) |
56.20 |
55.35 - 57.37 |
1.5154 times |
Mon 27 October 2025 |
55.98 (0.56%) |
55.74 |
55.63 - 57.32 |
0.8111 times |
Fri 24 October 2025 |
55.67 (-1.28%) |
56.15 |
55.42 - 56.75 |
0.8365 times |
Thu 23 October 2025 |
56.39 (0.37%) |
56.50 |
56.09 - 57.40 |
0.8753 times |
Tue 21 October 2025 |
56.18 (0.2%) |
56.42 |
56.00 - 56.90 |
0.2709 times |
Mon 20 October 2025 |
56.07 (2.65%) |
54.75 |
54.75 - 56.50 |
1.3863 times |
Fri 17 October 2025 |
54.62 (-1.62%) |
55.30 |
54.10 - 55.60 |
0.8912 times |
Thu 16 October 2025 |
55.52 (-0.18%) |
55.81 |
55.25 - 56.35 |
0.827 times |
Wed 15 October 2025 |
55.62 (1.2%) |
55.15 |
54.70 - 56.33 |
1.0431 times |
Tue 14 October 2025 |
54.96 (-3.09%) |
56.90 |
54.42 - 57.28 |
1.6557 times |
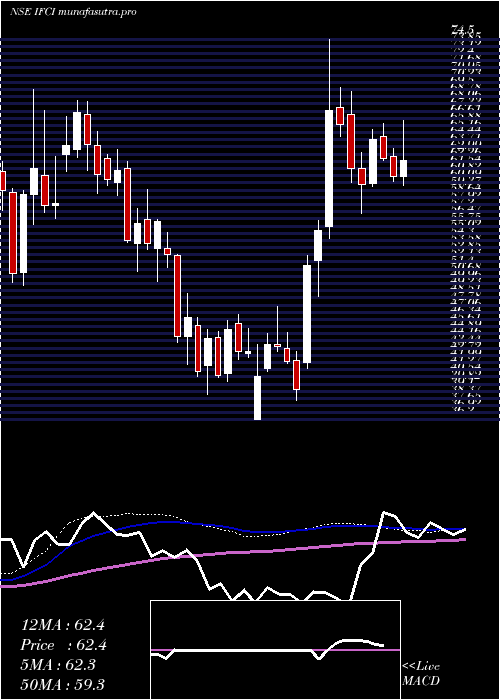
Weekly price and charts Ifci Strong weekly Stock price targets for Ifci IFCI are 56.21 and 58.31 | Weekly Target 1 | 54.52 | | Weekly Target 2 | 55.8 | | Weekly Target 3 | 56.623333333333 | | Weekly Target 4 | 57.9 | | Weekly Target 5 | 58.72 |
Weekly price and volumes for Ifci
| Date |
Closing |
Open |
Range |
Volume |
Wed 29 October 2025 |
57.07 (2.51%) |
55.74 |
55.35 - 57.45 |
0.5385 times |
Fri 24 October 2025 |
55.67 (1.92%) |
54.75 |
54.75 - 57.40 |
0.4689 times |
Fri 17 October 2025 |
54.62 (-5.52%) |
56.81 |
54.10 - 57.60 |
0.7577 times |
Fri 10 October 2025 |
57.81 (-0.58%) |
58.26 |
56.40 - 60.69 |
2.6858 times |
Fri 03 October 2025 |
58.15 (9.16%) |
53.51 |
52.92 - 58.61 |
0.7248 times |
Fri 26 September 2025 |
53.27 (-10.83%) |
59.49 |
53.10 - 59.98 |
0.7256 times |
Fri 19 September 2025 |
59.74 (11.94%) |
53.65 |
53.43 - 60.40 |
2.6497 times |
Fri 12 September 2025 |
53.37 (1.79%) |
52.90 |
52.65 - 55.18 |
0.5874 times |
Fri 05 September 2025 |
52.43 (2.64%) |
51.25 |
51.25 - 54.40 |
0.5468 times |
Fri 29 August 2025 |
51.08 (-5.48%) |
54.17 |
51.00 - 54.39 |
0.3148 times |
Fri 22 August 2025 |
54.04 (2.35%) |
53.15 |
53.10 - 56.38 |
0.6117 times |
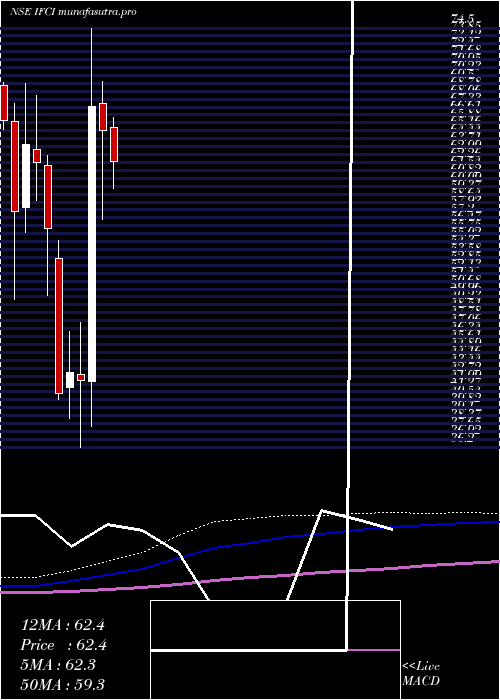
Monthly price and charts Ifci Strong monthly Stock price targets for Ifci IFCI are 55.54 and 62.22 | Monthly Target 1 | 50.58 | | Monthly Target 2 | 53.82 | | Monthly Target 3 | 57.256666666667 | | Monthly Target 4 | 60.5 | | Monthly Target 5 | 63.94 |
Monthly price and volumes Ifci
| Date |
Closing |
Open |
Range |
Volume |
Wed 29 October 2025 |
57.07 (5.59%) |
54.35 |
54.01 - 60.69 |
0.6109 times |
Tue 30 September 2025 |
54.05 (5.81%) |
51.25 |
51.25 - 60.40 |
0.5922 times |
Fri 29 August 2025 |
51.08 (-10.64%) |
57.00 |
51.00 - 58.70 |
0.2823 times |
Thu 31 July 2025 |
57.16 (-12.29%) |
65.50 |
56.90 - 66.33 |
0.6117 times |
Mon 30 June 2025 |
65.17 (-3.34%) |
67.65 |
57.00 - 69.69 |
1.597 times |
Fri 30 May 2025 |
67.42 (59.5%) |
42.20 |
38.15 - 74.50 |
3.9285 times |
Wed 30 April 2025 |
42.27 (-1.86%) |
42.90 |
36.20 - 47.61 |
0.4831 times |
Fri 28 March 2025 |
43.07 (4.82%) |
41.70 |
38.81 - 46.79 |
0.6213 times |
Fri 28 February 2025 |
41.09 (-26.93%) |
53.50 |
40.58 - 55.14 |
0.5743 times |
Fri 31 January 2025 |
56.23 (-9.69%) |
62.03 |
50.12 - 62.90 |
0.6986 times |
Tue 31 December 2024 |
62.26 (-2.52%) |
63.44 |
58.80 - 68.40 |
0.7393 times |
DMA SMA EMA moving averages of Ifci IFCI
DMA (daily moving average) of Ifci IFCI
| DMA period | DMA value | | 5 day DMA | 56.3 | | 12 day DMA | 55.93 | | 20 day DMA | 56.37 | | 35 day DMA | 56.15 | | 50 day DMA | 55.23 | | 100 day DMA | 57.86 | | 150 day DMA | 54.7 | | 200 day DMA | 53.25 | EMA (exponential moving average) of Ifci IFCI
| EMA period | EMA current | EMA prev | EMA prev2 | | 5 day EMA | 56.41 | 56.08 | 55.94 | | 12 day EMA | 56.22 | 56.07 | 56.02 | | 20 day EMA | 56.14 | 56.04 | 56.01 | | 35 day EMA | 55.66 | 55.58 | 55.53 | | 50 day EMA | 55.17 | 55.09 | 55.04 |
SMA (simple moving average) of Ifci IFCI
| SMA period | SMA current | SMA prev | SMA prev2 | | 5 day SMA | 56.3 | 56.12 | 56.06 | | 12 day SMA | 55.93 | 55.99 | 56.11 | | 20 day SMA | 56.37 | 56.17 | 56.01 | | 35 day SMA | 56.15 | 56.03 | 55.92 | | 50 day SMA | 55.23 | 55.15 | 55.09 | | 100 day SMA | 57.86 | 57.97 | 58.08 | | 150 day SMA | 54.7 | 54.61 | 54.53 | | 200 day SMA | 53.25 | 53.26 | 53.27 |
|
|
