IfbAgro IFBAGRO full analysis,charts,indicators,moving averages,SMA,DMA,EMA,ADX,MACD,RSIIfb Agro IFBAGRO WideScreen charts, DMA,SMA,EMA technical analysis, forecast prediction, by indicators ADX,MACD,RSI,CCI NSE stock exchange
operates under Breweries & Distilleries sector
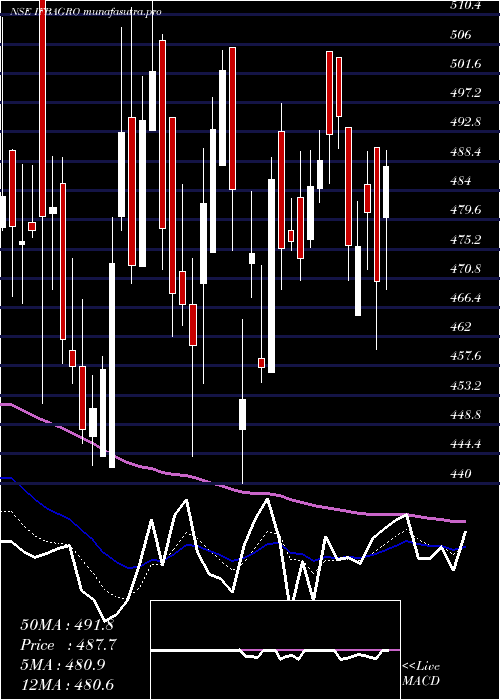
Daily price and charts and targets IfbAgro Strong Daily Stock price targets for IfbAgro IFBAGRO are 1268.45 and 1421.45 | Daily Target 1 | 1145.63 | | Daily Target 2 | 1238.27 | | Daily Target 3 | 1298.6333333333 | | Daily Target 4 | 1391.27 | | Daily Target 5 | 1451.63 |
Daily price and volume Ifb Agro
| Date |
Closing |
Open |
Range |
Volume |
Tue 28 October 2025 |
1330.90 (9.46%) |
1208.90 |
1206.00 - 1359.00 |
2.1357 times |
Mon 27 October 2025 |
1215.85 (7.31%) |
1137.80 |
1137.75 - 1289.15 |
3.3202 times |
Fri 24 October 2025 |
1133.00 (9.4%) |
1033.00 |
995.50 - 1188.00 |
1.1988 times |
Thu 23 October 2025 |
1035.65 (-7.72%) |
1136.50 |
1015.20 - 1140.95 |
0.3878 times |
Tue 21 October 2025 |
1122.35 (7.9%) |
1055.00 |
1042.05 - 1137.50 |
0.4661 times |
Mon 20 October 2025 |
1040.15 (7.53%) |
971.05 |
971.05 - 1047.85 |
0.4271 times |
Fri 17 October 2025 |
967.30 (-1.84%) |
984.95 |
951.00 - 998.00 |
0.1674 times |
Thu 16 October 2025 |
985.45 (6.13%) |
935.60 |
935.60 - 1060.00 |
1.6489 times |
Wed 15 October 2025 |
928.55 (0.38%) |
925.35 |
878.85 - 938.00 |
0.157 times |
Tue 14 October 2025 |
925.00 (-3.4%) |
970.00 |
910.90 - 970.00 |
0.091 times |
Mon 13 October 2025 |
957.55 (-1.56%) |
972.75 |
951.05 - 992.95 |
0.0582 times |
Weekly price and charts IfbAgro Strong weekly Stock price targets for IfbAgro IFBAGRO are 1234.33 and 1455.58 | Weekly Target 1 | 1054.63 | | Weekly Target 2 | 1192.77 | | Weekly Target 3 | 1275.8833333333 | | Weekly Target 4 | 1414.02 | | Weekly Target 5 | 1497.13 |
Weekly price and volumes for Ifb Agro
| Date |
Closing |
Open |
Range |
Volume |
Tue 28 October 2025 |
1330.90 (17.47%) |
1137.80 |
1137.75 - 1359.00 |
2.9736 times |
Fri 24 October 2025 |
1133.00 (17.13%) |
971.05 |
971.05 - 1188.00 |
1.3516 times |
Fri 17 October 2025 |
967.30 (-0.56%) |
972.75 |
878.85 - 1060.00 |
1.1568 times |
Fri 10 October 2025 |
972.75 (11.08%) |
879.90 |
865.05 - 1049.80 |
0.6771 times |
Fri 03 October 2025 |
875.75 (6.22%) |
849.00 |
805.45 - 880.00 |
0.1175 times |
Fri 26 September 2025 |
824.50 (4.49%) |
789.05 |
766.90 - 854.55 |
0.1612 times |
Fri 19 September 2025 |
789.05 (-0.11%) |
783.65 |
770.05 - 795.00 |
0.0953 times |
Fri 12 September 2025 |
789.95 (1.46%) |
780.00 |
751.20 - 808.75 |
0.0673 times |
Wed 04 June 2025 |
778.60 (10.75%) |
715.00 |
693.10 - 834.80 |
1.5262 times |
Fri 30 May 2025 |
703.00 (34.06%) |
541.90 |
526.40 - 718.00 |
1.8734 times |
Fri 23 May 2025 |
524.40 (-0.88%) |
531.05 |
516.00 - 545.00 |
0.0456 times |
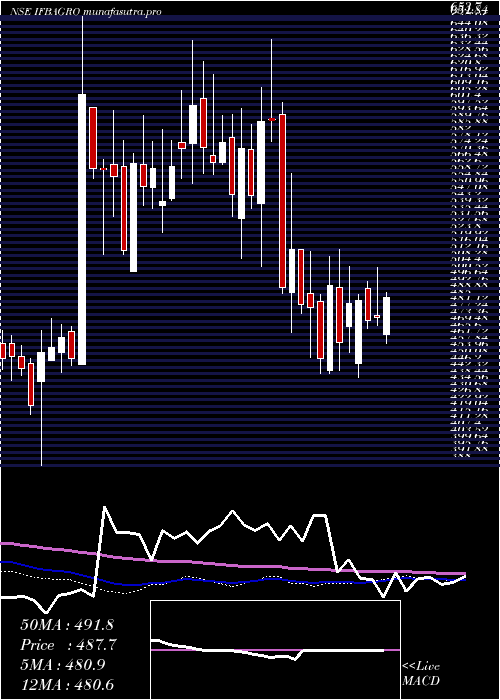
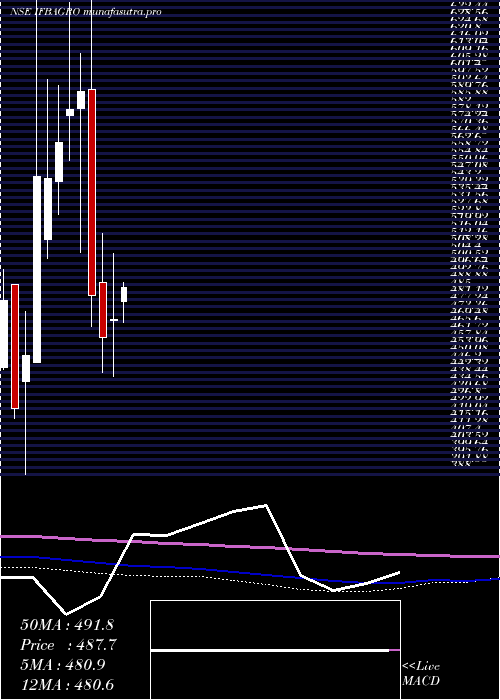
Monthly price and charts IfbAgro Strong monthly Stock price targets for IfbAgro IFBAGRO are 1071.93 and 1617.98 | Monthly Target 1 | 621.57 | | Monthly Target 2 | 976.23 | | Monthly Target 3 | 1167.6166666667 | | Monthly Target 4 | 1522.28 | | Monthly Target 5 | 1713.67 |
Monthly price and volumes Ifb Agro
| Date |
Closing |
Open |
Range |
Volume |
Tue 28 October 2025 |
1330.90 (63%) |
844.90 |
812.95 - 1359.00 |
4.7966 times |
Tue 30 September 2025 |
816.50 (4.87%) |
780.00 |
751.20 - 854.55 |
0.2891 times |
Wed 04 June 2025 |
778.60 (10.75%) |
715.00 |
693.10 - 834.80 |
1.1759 times |
Fri 30 May 2025 |
703.00 (49.49%) |
479.95 |
457.95 - 718.00 |
1.7353 times |
Wed 30 April 2025 |
470.25 (2.07%) |
470.00 |
440.00 - 505.55 |
0.1635 times |
Fri 28 March 2025 |
460.70 (-4.63%) |
490.00 |
442.30 - 516.05 |
0.2562 times |
Fri 28 February 2025 |
483.05 (-18.37%) |
593.00 |
466.60 - 640.00 |
0.313 times |
Fri 31 January 2025 |
591.75 (1.6%) |
582.80 |
506.00 - 611.90 |
0.4032 times |
Tue 31 December 2024 |
582.45 (3.11%) |
578.90 |
555.05 - 639.35 |
0.5984 times |
Fri 29 November 2024 |
564.90 (3.56%) |
544.00 |
526.10 - 595.20 |
0.2689 times |
Thu 31 October 2024 |
545.50 (-0.16%) |
513.05 |
503.00 - 598.00 |
0.2771 times |
DMA SMA EMA moving averages of Ifb Agro IFBAGRO
DMA (daily moving average) of Ifb Agro IFBAGRO
| DMA period | DMA value | | 5 day DMA | 1167.55 | | 12 day DMA | 1051.21 | | 20 day DMA | 986.78 | | 35 day DMA | 903.35 | | 50 day DMA | 810.03 | | 100 day DMA | 644.31 | | 150 day DMA | 616.73 | | 200 day DMA | 603.13 | EMA (exponential moving average) of Ifb Agro IFBAGRO
| EMA period | EMA current | EMA prev | EMA prev2 | | 5 day EMA | 1187.6 | 1115.96 | 1066.02 | | 12 day EMA | 1083.14 | 1038.11 | 1005.8 | | 20 day EMA | 1012.08 | 978.53 | 953.56 | | 35 day EMA | 909.48 | 884.67 | 865.17 | | 50 day EMA | 819.48 | 798.61 | 781.59 |
SMA (simple moving average) of Ifb Agro IFBAGRO
| SMA period | SMA current | SMA prev | SMA prev2 | | 5 day SMA | 1167.55 | 1109.4 | 1059.69 | | 12 day SMA | 1051.21 | 1022.55 | 1001.28 | | 20 day SMA | 986.78 | 961.46 | 941.88 | | 35 day SMA | 903.35 | 887.1 | 875.89 | | 50 day SMA | 810.03 | 793.01 | 778.27 | | 100 day SMA | 644.31 | 636.16 | 629.48 | | 150 day SMA | 616.73 | 611.93 | 607.7 | | 200 day SMA | 603.13 | 599.39 | 596.17 |
|
|
