IdfcamcIdfniftyet IDFNIFTYET full analysis,charts,indicators,moving averages,SMA,DMA,EMA,ADX,MACD,RSIIdfcamc Idfniftyet IDFNIFTYET WideScreen charts, DMA,SMA,EMA technical analysis, forecast prediction, by indicators ADX,MACD,RSI,CCI NSE stock exchange
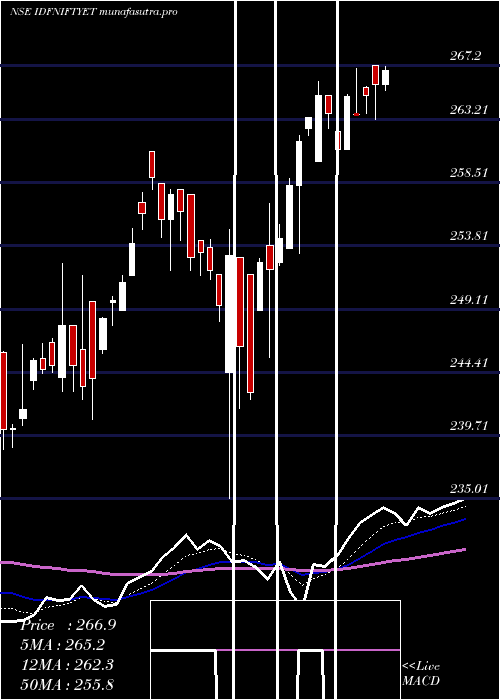
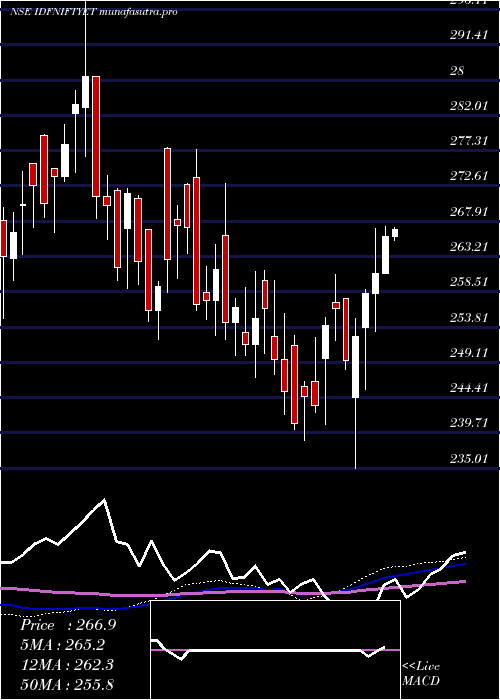
Daily price and charts and targets IdfcamcIdfniftyet Strong Daily Stock price targets for IdfcamcIdfniftyet IDFNIFTYET are 282.3 and 289.98 | Daily Target 1 | 276.43 | | Daily Target 2 | 280.48 | | Daily Target 3 | 284.11 | | Daily Target 4 | 288.16 | | Daily Target 5 | 291.79 |
Daily price and volume Idfcamc Idfniftyet
| Date |
Closing |
Open |
Range |
Volume |
Tue 28 October 2025 |
284.53 (0.37%) |
283.49 |
280.06 - 287.74 |
0.2461 times |
Mon 27 October 2025 |
283.49 (0.57%) |
286.11 |
277.79 - 286.35 |
1.1056 times |
Fri 24 October 2025 |
281.88 (-0.73%) |
284.29 |
281.87 - 284.43 |
0.2713 times |
Thu 23 October 2025 |
283.94 (0.72%) |
283.00 |
280.23 - 287.97 |
2.3324 times |
Tue 21 October 2025 |
281.90 (-0.7%) |
284.12 |
279.98 - 284.13 |
0.0578 times |
Mon 20 October 2025 |
283.89 (0.67%) |
282.00 |
282.00 - 284.13 |
0.4148 times |
Fri 17 October 2025 |
282.00 (1.01%) |
279.19 |
278.61 - 283.37 |
0.5053 times |
Thu 16 October 2025 |
279.19 (-0.41%) |
285.59 |
278.73 - 285.90 |
1.747 times |
Wed 15 October 2025 |
280.34 (-0.69%) |
282.97 |
277.26 - 282.97 |
0.4475 times |
Tue 14 October 2025 |
282.30 (2.42%) |
275.64 |
274.54 - 285.56 |
2.8722 times |
Mon 13 October 2025 |
275.64 (-0.77%) |
279.17 |
275.38 - 279.17 |
1.0096 times |
Weekly price and charts IdfcamcIdfniftyet Strong weekly Stock price targets for IdfcamcIdfniftyet IDFNIFTYET are 276.19 and 286.14 | Weekly Target 1 | 273.4 | | Weekly Target 2 | 278.97 | | Weekly Target 3 | 283.35333333333 | | Weekly Target 4 | 288.92 | | Weekly Target 5 | 293.3 |
Weekly price and volumes for Idfcamc Idfniftyet
| Date |
Closing |
Open |
Range |
Volume |
Tue 28 October 2025 |
284.53 (0.94%) |
286.11 |
277.79 - 287.74 |
0.469 times |
Fri 24 October 2025 |
281.88 (-0.04%) |
282.00 |
279.98 - 287.97 |
1.0674 times |
Fri 17 October 2025 |
282.00 (1.52%) |
279.17 |
274.54 - 285.90 |
2.2835 times |
Fri 10 October 2025 |
277.79 (2.01%) |
272.32 |
271.81 - 279.38 |
1.9323 times |
Fri 03 October 2025 |
272.32 (0.7%) |
272.00 |
269.08 - 275.92 |
0.7274 times |
Fri 26 September 2025 |
270.42 (-2.71%) |
277.96 |
270.20 - 277.96 |
0.4916 times |
Fri 19 September 2025 |
277.96 (1.35%) |
275.54 |
273.97 - 279.53 |
0.5165 times |
Fri 12 September 2025 |
274.26 (1.2%) |
275.07 |
268.00 - 278.39 |
1.0735 times |
Fri 05 September 2025 |
271.00 (1.01%) |
272.31 |
268.04 - 272.86 |
0.7866 times |
Fri 29 August 2025 |
268.29 (-1.83%) |
274.65 |
267.72 - 275.62 |
0.6521 times |
Fri 22 August 2025 |
273.29 (1.53%) |
273.18 |
268.10 - 274.91 |
16.631 times |
Monthly price and charts IdfcamcIdfniftyet Strong monthly Stock price targets for IdfcamcIdfniftyet IDFNIFTYET are 276.81 and 295.7 | Monthly Target 1 | 261.64 | | Monthly Target 2 | 273.08 | | Monthly Target 3 | 280.52666666667 | | Monthly Target 4 | 291.97 | | Monthly Target 5 | 299.42 |
Monthly price and volumes Idfcamc Idfniftyet
| Date |
Closing |
Open |
Range |
Volume |
Tue 28 October 2025 |
284.53 (4.93%) |
274.00 |
269.08 - 287.97 |
0.4355 times |
Tue 30 September 2025 |
271.17 (1.07%) |
272.31 |
268.00 - 279.53 |
0.2153 times |
Fri 29 August 2025 |
268.29 (-1.27%) |
273.10 |
266.29 - 275.62 |
2.1444 times |
Thu 31 July 2025 |
271.75 (-2.47%) |
277.25 |
269.41 - 281.43 |
2.8872 times |
Mon 30 June 2025 |
278.64 (3.09%) |
270.30 |
260.11 - 282.44 |
0.3418 times |
Fri 30 May 2025 |
270.30 (2%) |
267.20 |
259.68 - 274.80 |
1.9354 times |
Wed 30 April 2025 |
265.00 (3.38%) |
257.61 |
235.01 - 266.99 |
0.4661 times |
Fri 28 March 2025 |
256.33 (6.37%) |
245.85 |
238.66 - 260.85 |
0.6503 times |
Fri 28 February 2025 |
240.99 (-5.49%) |
259.97 |
240.10 - 261.32 |
0.4354 times |
Fri 31 January 2025 |
255.00 (-0.79%) |
260.41 |
247.06 - 273.00 |
0.4887 times |
Tue 31 December 2024 |
257.03 (-2.21%) |
268.10 |
252.68 - 277.42 |
0.3432 times |

DMA SMA EMA moving averages of Idfcamc Idfniftyet IDFNIFTYET
DMA (daily moving average) of Idfcamc Idfniftyet IDFNIFTYET
| DMA period | DMA value | | 5 day DMA | 283.15 | | 12 day DMA | 281.41 | | 20 day DMA | 278.15 | | 35 day DMA | 276.74 | | 50 day DMA | 275.1 | | 100 day DMA | 274.17 | | 150 day DMA | 270.2 | | 200 day DMA | 265.25 | EMA (exponential moving average) of Idfcamc Idfniftyet IDFNIFTYET
| EMA period | EMA current | EMA prev | EMA prev2 | | 5 day EMA | 283.24 | 282.6 | 282.15 | | 12 day EMA | 281.33 | 280.75 | 280.25 | | 20 day EMA | 279.59 | 279.07 | 278.6 | | 35 day EMA | 277.26 | 276.83 | 276.44 | | 50 day EMA | 275.34 | 274.96 | 274.61 |
SMA (simple moving average) of Idfcamc Idfniftyet IDFNIFTYET
| SMA period | SMA current | SMA prev | SMA prev2 | | 5 day SMA | 283.15 | 283.02 | 282.72 | | 12 day SMA | 281.41 | 280.62 | 279.88 | | 20 day SMA | 278.15 | 277.45 | 277 | | 35 day SMA | 276.74 | 276.35 | 275.98 | | 50 day SMA | 275.1 | 274.79 | 274.48 | | 100 day SMA | 274.17 | 274.03 | 273.88 | | 150 day SMA | 270.2 | 269.97 | 269.73 | | 200 day SMA | 265.25 | 265.14 | 265.03 |
|
|
