VodafoneIdea IDEA_T0 full analysis,charts,indicators,moving averages,SMA,DMA,EMA,ADX,MACD,RSIVodafone Idea IDEA_T0 WideScreen charts, DMA,SMA,EMA technical analysis, forecast prediction, by indicators ADX,MACD,RSI,CCI NSE stock exchange
Daily price and charts and targets VodafoneIdea Strong Daily Stock price targets for VodafoneIdea IDEA_T0 are 9.39 and 9.6 | Daily Target 1 | 9.37 | | Daily Target 2 | 9.41 | | Daily Target 3 | 9.5833333333333 | | Daily Target 4 | 9.62 | | Daily Target 5 | 9.79 |
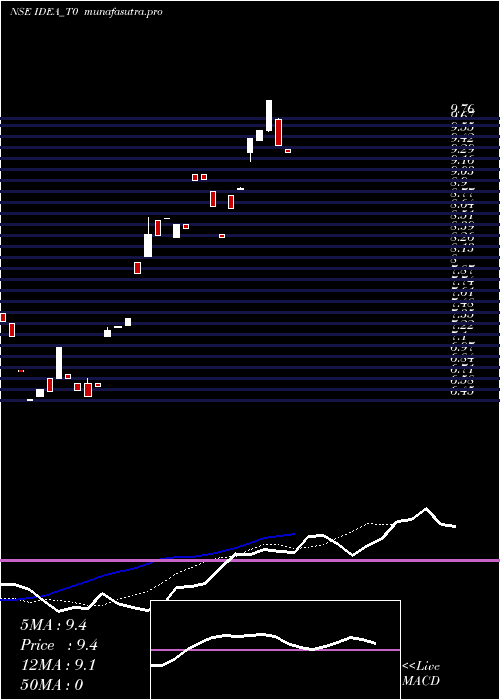
Daily price and volume Vodafone Idea
| Date |
Closing |
Open |
Range |
Volume |
Tue 28 October 2025 |
9.44 (-5.32%) |
9.75 |
9.55 - 9.76 |
1.9444 times |
Mon 27 October 2025 |
9.97 (3.64%) |
9.62 |
9.61 - 9.75 |
1.3889 times |
Fri 24 October 2025 |
9.62 (1.05%) |
9.50 |
9.50 - 9.50 |
1.3889 times |
Thu 23 October 2025 |
9.52 (6.49%) |
9.36 |
9.26 - 9.36 |
1.6667 times |
Mon 20 October 2025 |
8.94 (2.76%) |
8.93 |
8.93 - 8.95 |
1.1111 times |
Fri 17 October 2025 |
8.70 (4.07%) |
8.85 |
8.85 - 8.85 |
0.2778 times |
Tue 14 October 2025 |
8.36 (-4.24%) |
8.40 |
8.40 - 8.40 |
0.5556 times |
Mon 13 October 2025 |
8.73 (-3.43%) |
8.90 |
8.90 - 8.90 |
0.2778 times |
Fri 10 October 2025 |
9.04 (0.11%) |
9.10 |
9.10 - 9.10 |
0.2778 times |
Thu 09 October 2025 |
9.03 (6.61%) |
9.10 |
9.05 - 9.10 |
1.1111 times |
Mon 06 October 2025 |
8.47 (-0.59%) |
8.52 |
8.52 - 8.52 |
0.2778 times |
Weekly price and charts VodafoneIdea Strong weekly Stock price targets for VodafoneIdea IDEA_T0 are 9.39 and 9.6 | Weekly Target 1 | 9.37 | | Weekly Target 2 | 9.41 | | Weekly Target 3 | 9.5833333333333 | | Weekly Target 4 | 9.62 | | Weekly Target 5 | 9.79 |
Weekly price and volumes for Vodafone Idea
| Date |
Closing |
Open |
Range |
Volume |
Tue 28 October 2025 |
9.44 (-1.87%) |
9.62 |
9.55 - 9.76 |
0.6283 times |
Fri 24 October 2025 |
9.62 (10.57%) |
8.93 |
8.93 - 9.50 |
0.7853 times |
Fri 17 October 2025 |
8.70 (-3.76%) |
8.90 |
8.40 - 8.90 |
0.2094 times |
Fri 10 October 2025 |
9.04 (6.1%) |
8.52 |
8.52 - 9.10 |
0.3141 times |
Wed 01 October 2025 |
8.52 (-0.81%) |
8.36 |
8.36 - 8.36 |
0.2094 times |
Wed 24 September 2025 |
8.59 (2.26%) |
8.56 |
8.40 - 8.58 |
0.1571 times |
Fri 19 September 2025 |
8.40 (13.36%) |
8.07 |
8.00 - 8.60 |
3.9791 times |
Thu 11 September 2025 |
7.41 (12.1%) |
7.20 |
7.20 - 7.33 |
2.1466 times |
Thu 04 September 2025 |
6.61 (1.85%) |
6.65 |
6.65 - 6.65 |
0.0524 times |
Fri 29 August 2025 |
6.49 (-8.2%) |
6.75 |
6.60 - 6.75 |
1.5183 times |
Fri 22 August 2025 |
7.07 (0%) |
6.45 |
6.45 - 6.70 |
1.4136 times |

Monthly price and charts VodafoneIdea Strong monthly Stock price targets for VodafoneIdea IDEA_T0 are 8.9 and 10.3 | Monthly Target 1 | 7.79 | | Monthly Target 2 | 8.61 | | Monthly Target 3 | 9.1866666666667 | | Monthly Target 4 | 10.01 | | Monthly Target 5 | 10.59 |
Monthly price and volumes Vodafone Idea
| Date |
Closing |
Open |
Range |
Volume |
Tue 28 October 2025 |
9.44 (9.9%) |
8.36 |
8.36 - 9.76 |
0.7289 times |
Wed 24 September 2025 |
8.59 (32.36%) |
6.65 |
6.65 - 8.60 |
2.1511 times |
Fri 29 August 2025 |
6.49 (-9.86%) |
6.80 |
6.45 - 6.80 |
1.0133 times |
Fri 25 July 2025 |
7.20 (0%) |
7.47 |
7.30 - 7.47 |
0.1067 times |
Wed 29 October 2025 |
(0%) |
|
- |
0 times |

DMA SMA EMA moving averages of Vodafone Idea IDEA_T0
DMA (daily moving average) of Vodafone Idea IDEA_T0
| DMA period | DMA value | | 5 day DMA | 9.5 | | 12 day DMA | 9.03 | | 20 day DMA | 8.51 | | 35 day DMA | | | 50 day DMA | | | 100 day DMA | | | 150 day DMA | | | 200 day DMA | | EMA (exponential moving average) of Vodafone Idea IDEA_T0
| EMA period | EMA current | EMA prev | EMA prev2 | | 5 day EMA | 9.45 | 9.46 | 9.21 | | 12 day EMA | 9.03 | 8.95 | 8.77 | | 20 day EMA | 8.54 | 8.44 | 8.28 | | 35 day EMA | 0 | 0 | 0 | | 50 day EMA | 0 | 0 | 0 |
SMA (simple moving average) of Vodafone Idea IDEA_T0
| SMA period | SMA current | SMA prev | SMA prev2 | | 5 day SMA | 9.5 | 9.35 | 9.03 | | 12 day SMA | 9.03 | 8.96 | 8.83 | | 20 day SMA | 8.51 | 8.37 | 8.2 | | 35 day SMA | | 50 day SMA | | 100 day SMA | | 150 day SMA | | 200 day SMA |
|
|
