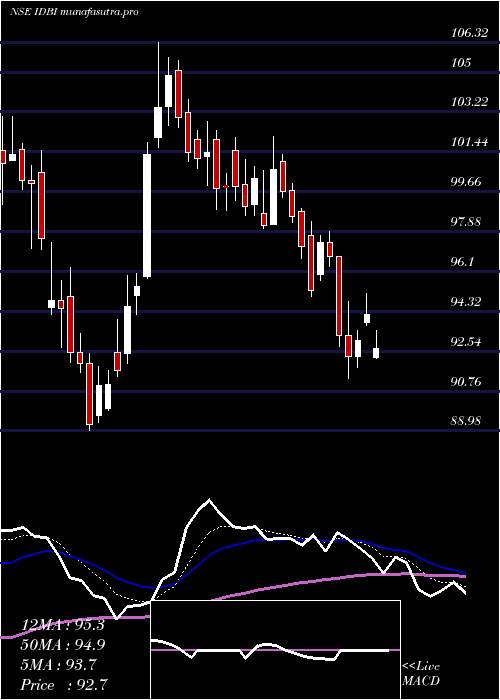
IdbiBank IDBI full analysis,charts,indicators,moving averages,SMA,DMA,EMA,ADX,MACD,RSIIdbi Bank IDBI WideScreen charts, DMA,SMA,EMA technical analysis, forecast prediction, by indicators ADX,MACD,RSI,CCI NSE stock exchange
operates under Banks sector
Daily price and charts and targets IdbiBank Strong Daily Stock price targets for IdbiBank IDBI are 92.77 and 95.71 | Daily Target 1 | 92.2 | | Daily Target 2 | 93.33 | | Daily Target 3 | 95.143333333333 | | Daily Target 4 | 96.27 | | Daily Target 5 | 98.08 |
Daily price and volume Idbi Bank
| Date |
Closing |
Open |
Range |
Volume |
Wed 10 December 2025 |
94.45 (-0.96%) |
95.60 |
94.02 - 96.96 |
0.7879 times |
Tue 09 December 2025 |
95.37 (0.62%) |
94.50 |
92.52 - 95.93 |
1.3462 times |
Mon 08 December 2025 |
94.78 (-2.69%) |
97.44 |
94.14 - 97.64 |
1.0705 times |
Fri 05 December 2025 |
97.40 (-0.25%) |
98.00 |
96.92 - 98.25 |
0.844 times |
Thu 04 December 2025 |
97.64 (-0.01%) |
97.65 |
96.89 - 98.60 |
0.7742 times |
Wed 03 December 2025 |
97.65 (-2.12%) |
99.90 |
97.15 - 100.27 |
1.375 times |
Tue 02 December 2025 |
99.76 (-0.37%) |
100.37 |
99.42 - 102.24 |
1.0546 times |
Mon 01 December 2025 |
100.13 (-0.25%) |
100.80 |
99.81 - 102.05 |
1.0466 times |
Fri 28 November 2025 |
100.38 (-0.8%) |
101.70 |
100.00 - 101.70 |
0.7607 times |
Thu 27 November 2025 |
101.19 (-0.75%) |
102.90 |
100.55 - 102.96 |
0.9404 times |
Wed 26 November 2025 |
101.95 (0.74%) |
101.72 |
101.30 - 103.57 |
1.2927 times |
Weekly price and charts IdbiBank Strong weekly Stock price targets for IdbiBank IDBI are 90.93 and 96.05 | Weekly Target 1 | 89.75 | | Weekly Target 2 | 92.1 | | Weekly Target 3 | 94.87 | | Weekly Target 4 | 97.22 | | Weekly Target 5 | 99.99 |
Weekly price and volumes for Idbi Bank
| Date |
Closing |
Open |
Range |
Volume |
Wed 10 December 2025 |
94.45 (-3.03%) |
97.44 |
92.52 - 97.64 |
0.3678 times |
Fri 05 December 2025 |
97.40 (-2.97%) |
100.80 |
96.89 - 102.24 |
0.5847 times |
Fri 28 November 2025 |
100.38 (0.14%) |
100.50 |
98.70 - 103.57 |
0.6797 times |
Fri 21 November 2025 |
100.24 (-0.79%) |
101.50 |
100.00 - 105.94 |
1.5127 times |
Fri 14 November 2025 |
101.04 (0.62%) |
100.85 |
97.58 - 102.11 |
0.8075 times |
Fri 07 November 2025 |
100.42 (-3.26%) |
104.20 |
95.83 - 104.49 |
0.8643 times |
Fri 31 October 2025 |
103.80 (10.51%) |
94.40 |
94.08 - 106.97 |
3.5934 times |
Fri 24 October 2025 |
93.93 (2.41%) |
93.40 |
91.43 - 97.90 |
0.821 times |
Fri 17 October 2025 |
91.72 (-1.86%) |
93.62 |
91.20 - 94.85 |
0.4034 times |
Fri 10 October 2025 |
93.46 (0.93%) |
93.20 |
90.86 - 94.65 |
0.3655 times |
Fri 03 October 2025 |
92.60 (3.38%) |
89.20 |
88.57 - 93.54 |
0.4174 times |

Monthly price and charts IdbiBank Strong monthly Stock price targets for IdbiBank IDBI are 88.63 and 98.35 | Monthly Target 1 | 86.68 | | Monthly Target 2 | 90.57 | | Monthly Target 3 | 96.403333333333 | | Monthly Target 4 | 100.29 | | Monthly Target 5 | 106.12 |
Monthly price and volumes Idbi Bank
| Date |
Closing |
Open |
Range |
Volume |
Wed 10 December 2025 |
94.45 (-5.91%) |
100.80 |
92.52 - 102.24 |
0.2996 times |
Fri 28 November 2025 |
100.38 (-3.29%) |
104.20 |
95.83 - 105.94 |
1.2154 times |
Fri 31 October 2025 |
103.80 (13.54%) |
91.95 |
90.70 - 106.97 |
1.68 times |
Tue 30 September 2025 |
91.42 (6.71%) |
86.10 |
86.09 - 96.20 |
0.8161 times |
Fri 29 August 2025 |
85.67 (-7.55%) |
92.65 |
84.11 - 99.00 |
0.7701 times |
Thu 31 July 2025 |
92.67 (-10.4%) |
103.44 |
91.30 - 105.65 |
0.8849 times |
Mon 30 June 2025 |
103.43 (6.84%) |
96.90 |
88.98 - 106.32 |
1.701 times |
Fri 30 May 2025 |
96.81 (21.27%) |
79.85 |
75.00 - 98.70 |
1.2868 times |
Wed 30 April 2025 |
79.83 (2.74%) |
78.00 |
72.00 - 88.12 |
0.7362 times |
Fri 28 March 2025 |
77.70 (12.22%) |
69.74 |
66.50 - 82.12 |
0.6099 times |
Fri 28 February 2025 |
69.24 (-14.64%) |
78.68 |
68.70 - 83.38 |
0.3764 times |

DMA SMA EMA moving averages of Idbi Bank IDBI
DMA (daily moving average) of Idbi Bank IDBI
| DMA period | DMA value | | 5 day DMA | 95.93 | | 12 day DMA | 98.49 | | 20 day DMA | 99.63 | | 35 day DMA | 99.22 | | 50 day DMA | 97.12 | | 100 day DMA | 94.58 | | 150 day DMA | 94.7 | | 200 day DMA | 90.2 | EMA (exponential moving average) of Idbi Bank IDBI
| EMA period | EMA current | EMA prev | EMA prev2 | | 5 day EMA | 95.86 | 96.57 | 97.17 | | 12 day EMA | 97.61 | 98.18 | 98.69 | | 20 day EMA | 98.25 | 98.65 | 99 | | 35 day EMA | 97.64 | 97.83 | 97.97 | | 50 day EMA | 96.55 | 96.64 | 96.69 |
SMA (simple moving average) of Idbi Bank IDBI
| SMA period | SMA current | SMA prev | SMA prev2 | | 5 day SMA | 95.93 | 96.57 | 97.45 | | 12 day SMA | 98.49 | 98.87 | 99.27 | | 20 day SMA | 99.63 | 99.9 | 100.08 | | 35 day SMA | 99.22 | 99.21 | 99.1 | | 50 day SMA | 97.12 | 97.02 | 96.93 | | 100 day SMA | 94.58 | 94.64 | 94.67 | | 150 day SMA | 94.7 | 94.59 | 94.47 | | 200 day SMA | 90.2 | 90.08 | 89.97 |
|
|
