Icds ICDSLTD full analysis,charts,indicators,moving averages,SMA,DMA,EMA,ADX,MACD,RSIIcds ICDSLTD WideScreen charts, DMA,SMA,EMA technical analysis, forecast prediction, by indicators ADX,MACD,RSI,CCI NSE stock exchange
Daily price and charts and targets Icds Strong Daily Stock price targets for Icds ICDSLTD are 43.07 and 47.77 | Daily Target 1 | 42.24 | | Daily Target 2 | 43.89 | | Daily Target 3 | 46.943333333333 | | Daily Target 4 | 48.59 | | Daily Target 5 | 51.64 |
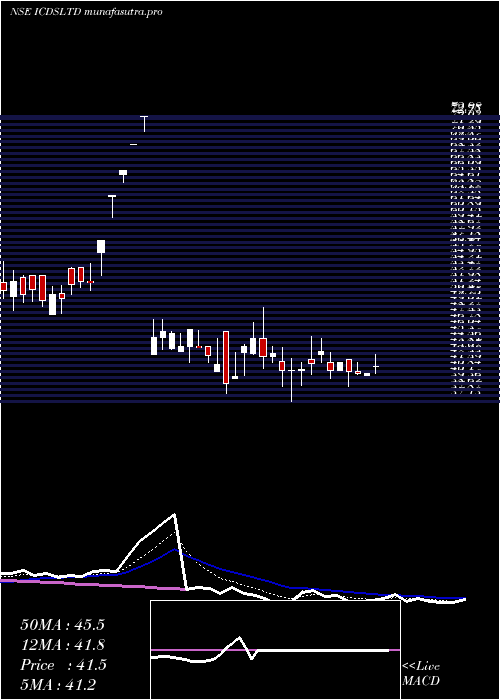
Daily price and volume Icds
| Date |
Closing |
Open |
Range |
Volume |
Wed 10 December 2025 |
45.53 (0.13%) |
45.75 |
45.30 - 50.00 |
0.9336 times |
Tue 09 December 2025 |
45.47 (6.86%) |
42.40 |
40.99 - 46.80 |
2.8297 times |
Mon 08 December 2025 |
42.55 (-3.27%) |
43.99 |
41.63 - 43.99 |
0.1261 times |
Fri 05 December 2025 |
43.99 (1.71%) |
44.25 |
42.40 - 44.25 |
0.1749 times |
Thu 04 December 2025 |
43.25 (0.56%) |
42.15 |
42.15 - 44.98 |
0.1522 times |
Wed 03 December 2025 |
43.01 (-4.42%) |
45.90 |
43.00 - 45.90 |
0.2234 times |
Tue 02 December 2025 |
45.00 (-13.46%) |
45.50 |
45.00 - 45.50 |
0.0305 times |
Wed 01 October 2025 |
52.00 (-4.32%) |
51.63 |
51.63 - 56.80 |
1.4676 times |
Tue 30 September 2025 |
54.35 (-5.02%) |
57.79 |
54.35 - 57.79 |
0.7017 times |
Mon 29 September 2025 |
57.22 (-3.61%) |
62.15 |
56.50 - 62.32 |
3.3602 times |
Fri 26 September 2025 |
59.36 (4.45%) |
59.00 |
57.00 - 59.67 |
3.3117 times |
Weekly price and charts Icds Strong weekly Stock price targets for Icds ICDSLTD are 43.26 and 52.27 | Weekly Target 1 | 36.5 | | Weekly Target 2 | 41.01 | | Weekly Target 3 | 45.506666666667 | | Weekly Target 4 | 50.02 | | Weekly Target 5 | 54.52 |
Weekly price and volumes for Icds
| Date |
Closing |
Open |
Range |
Volume |
Wed 10 December 2025 |
45.53 (3.5%) |
43.99 |
40.99 - 50.00 |
0.2527 times |
Fri 05 December 2025 |
43.99 (-15.4%) |
45.50 |
42.15 - 45.90 |
0.0378 times |
Wed 01 October 2025 |
52.00 (-12.4%) |
62.15 |
51.63 - 62.32 |
0.3593 times |
Fri 26 September 2025 |
59.36 (14.75%) |
53.99 |
52.24 - 59.67 |
1.232 times |
Fri 19 September 2025 |
51.73 (-11.89%) |
48.36 |
46.00 - 52.13 |
4.4844 times |
Wed 28 May 2025 |
58.71 (-10%) |
68.49 |
57.24 - 68.49 |
0.5812 times |
Fri 23 May 2025 |
65.23 (26%) |
54.00 |
51.77 - 65.23 |
1.4886 times |
Fri 16 May 2025 |
51.77 (29.17%) |
40.08 |
40.02 - 51.77 |
0.6597 times |
Fri 09 May 2025 |
40.08 (-1.28%) |
41.48 |
38.00 - 43.98 |
0.8793 times |
Fri 02 May 2025 |
40.60 (-0.9%) |
41.01 |
39.02 - 42.40 |
0.0248 times |
Fri 25 April 2025 |
40.97 (-0.05%) |
40.99 |
37.13 - 45.25 |
1.2863 times |
Monthly price and charts Icds Strong monthly Stock price targets for Icds ICDSLTD are 43.26 and 52.27 | Monthly Target 1 | 36.5 | | Monthly Target 2 | 41.01 | | Monthly Target 3 | 45.506666666667 | | Monthly Target 4 | 50.02 | | Monthly Target 5 | 54.52 |
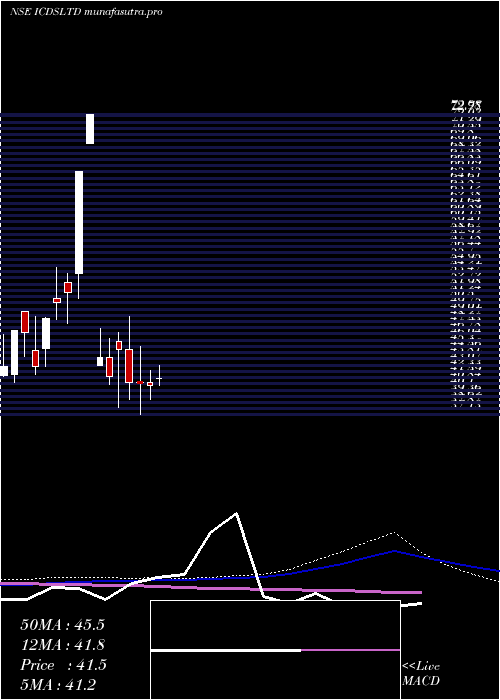
Monthly price and volumes Icds
| Date |
Closing |
Open |
Range |
Volume |
Wed 10 December 2025 |
45.53 (-12.44%) |
45.50 |
40.99 - 50.00 |
0.1167 times |
Wed 01 October 2025 |
52.00 (-4.32%) |
51.63 |
51.63 - 56.80 |
0.0383 times |
Tue 30 September 2025 |
54.35 (-7.43%) |
48.36 |
46.00 - 62.32 |
2.4033 times |
Wed 28 May 2025 |
58.71 (44.71%) |
40.36 |
38.00 - 68.49 |
1.4508 times |
Wed 30 April 2025 |
40.57 (-7.82%) |
44.01 |
37.13 - 48.87 |
0.9204 times |
Fri 28 March 2025 |
44.01 (-39.7%) |
43.01 |
43.01 - 47.46 |
0.0494 times |
Tue 17 December 2024 |
72.98 (44.46%) |
52.95 |
48.05 - 72.98 |
2.2683 times |
Fri 29 November 2024 |
50.52 (12.34%) |
46.10 |
42.01 - 54.73 |
1.4406 times |
Thu 31 October 2024 |
44.97 (0%) |
41.81 |
40.94 - 46.77 |
0.3122 times |
Wed 10 December 2025 |
(0%) |
|
- |
0 times |

DMA SMA EMA moving averages of Icds ICDSLTD
DMA (daily moving average) of Icds ICDSLTD
| DMA period | DMA value | | 5 day DMA | 44.16 | | 12 day DMA | 49.05 | | 20 day DMA | 49.81 | | 35 day DMA | 50.95 | | 50 day DMA | 48.09 | | 100 day DMA | 48.27 | | 150 day DMA | | | 200 day DMA | | EMA (exponential moving average) of Icds ICDSLTD
| EMA period | EMA current | EMA prev | EMA prev2 | | 5 day EMA | 45.18 | 45 | 44.76 | | 12 day EMA | 47.44 | 47.79 | 48.21 | | 20 day EMA | 48.81 | 49.15 | 49.54 | | 35 day EMA | 48.1 | 48.25 | 48.41 | | 50 day EMA | 47.21 | 47.28 | 47.35 |
SMA (simple moving average) of Icds ICDSLTD
| SMA period | SMA current | SMA prev | SMA prev2 | | 5 day SMA | 44.16 | 43.65 | 43.56 | | 12 day SMA | 49.05 | 49.78 | 50.57 | | 20 day SMA | 49.81 | 50.47 | 51.21 | | 35 day SMA | 50.95 | 50.8 | 50.65 | | 50 day SMA | 48.09 | 48.07 | 48.05 | | 100 day SMA | 48.27 | | 150 day SMA | | 200 day SMA |
|
|
