IblFinance IBLFL_SM full analysis,charts,indicators,moving averages,SMA,DMA,EMA,ADX,MACD,RSIIbl Finance IBLFL_SM WideScreen charts, DMA,SMA,EMA technical analysis, forecast prediction, by indicators ADX,MACD,RSI,CCI NSE stock exchange
Daily price and charts and targets IblFinance Strong Daily Stock price targets for IblFinance IBLFL_SM are 67.65 and 67.65 | Daily Target 1 | 67.65 | | Daily Target 2 | 67.65 | | Daily Target 3 | 67.65 | | Daily Target 4 | 67.65 | | Daily Target 5 | 67.65 |
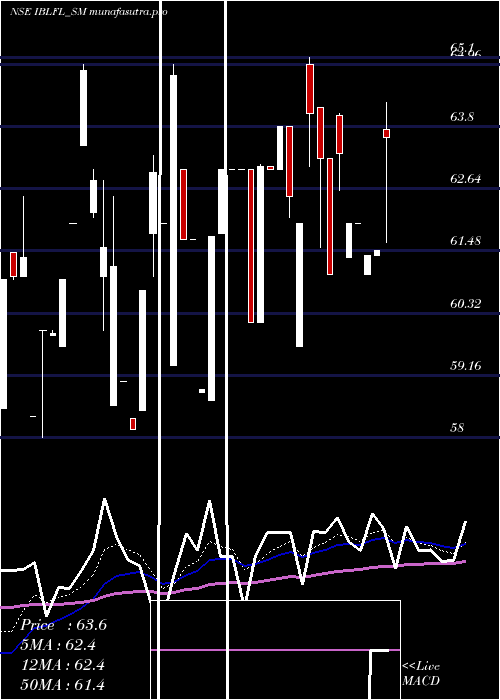
Daily price and volume Ibl Finance
| Date |
Closing |
Open |
Range |
Volume |
Tue 28 October 2025 |
67.65 (-0.44%) |
67.65 |
67.65 - 67.65 |
0.5 times |
Mon 27 October 2025 |
67.95 (0.15%) |
68.00 |
65.30 - 69.00 |
0.875 times |
Fri 24 October 2025 |
67.85 (-1.67%) |
69.00 |
66.05 - 69.00 |
2.625 times |
Tue 21 October 2025 |
69.00 (3.76%) |
68.90 |
68.90 - 69.00 |
3.5 times |
Mon 20 October 2025 |
66.50 (0%) |
66.50 |
66.50 - 66.50 |
0.125 times |
Thu 16 October 2025 |
66.50 (-3.34%) |
68.90 |
66.50 - 68.90 |
0.25 times |
Mon 13 October 2025 |
68.80 (-1.64%) |
66.60 |
66.60 - 69.00 |
0.5 times |
Fri 10 October 2025 |
69.95 (0%) |
69.90 |
67.50 - 69.95 |
1 times |
Thu 09 October 2025 |
69.95 (0%) |
66.55 |
66.55 - 69.95 |
0.375 times |
Wed 08 October 2025 |
69.95 (2.04%) |
69.00 |
69.00 - 69.95 |
0.25 times |
Tue 07 October 2025 |
68.55 (4.98%) |
67.20 |
67.20 - 68.55 |
3.625 times |
Weekly price and charts IblFinance Strong weekly Stock price targets for IblFinance IBLFL_SM are 64.63 and 68.33 | Weekly Target 1 | 63.62 | | Weekly Target 2 | 65.63 | | Weekly Target 3 | 67.316666666667 | | Weekly Target 4 | 69.33 | | Weekly Target 5 | 71.02 |
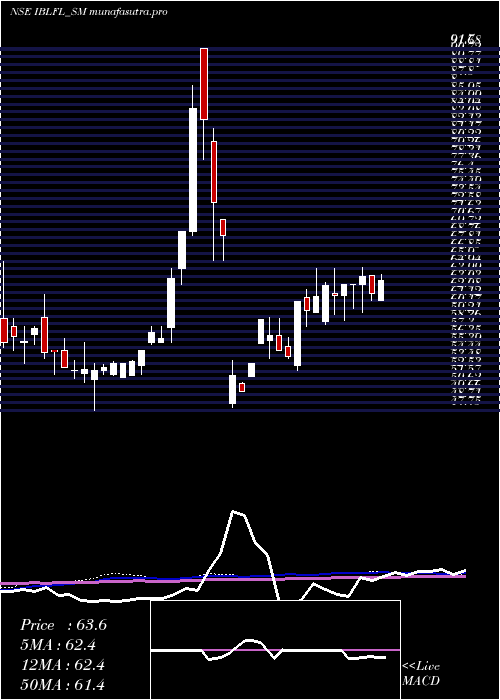
Weekly price and volumes for Ibl Finance
| Date |
Closing |
Open |
Range |
Volume |
Tue 28 October 2025 |
67.65 (-0.29%) |
68.00 |
65.30 - 69.00 |
0.4183 times |
Fri 24 October 2025 |
67.85 (2.03%) |
66.50 |
66.05 - 69.00 |
1.9011 times |
Thu 16 October 2025 |
66.50 (-4.93%) |
66.60 |
66.50 - 69.00 |
0.2281 times |
Fri 10 October 2025 |
69.95 (11.3%) |
64.95 |
60.00 - 69.95 |
2.0532 times |
Fri 03 October 2025 |
62.85 (-6.61%) |
64.30 |
62.05 - 67.50 |
0.7224 times |
Fri 26 September 2025 |
67.30 (0.22%) |
67.00 |
64.15 - 67.35 |
0.7605 times |
Wed 17 September 2025 |
67.15 (6.42%) |
66.10 |
64.00 - 67.15 |
0.5703 times |
Fri 12 September 2025 |
63.10 (-3.66%) |
62.35 |
62.35 - 66.00 |
1.1407 times |
Thu 04 September 2025 |
65.50 (-6.23%) |
66.40 |
65.35 - 72.80 |
1.3688 times |
Fri 29 August 2025 |
69.85 (-1.41%) |
73.00 |
69.20 - 73.00 |
0.8365 times |
Fri 22 August 2025 |
70.85 (6.94%) |
65.00 |
65.00 - 74.00 |
2.0913 times |
Monthly price and charts IblFinance Strong monthly Stock price targets for IblFinance IBLFL_SM are 63.83 and 73.78 | Monthly Target 1 | 55.92 | | Monthly Target 2 | 61.78 | | Monthly Target 3 | 65.866666666667 | | Monthly Target 4 | 71.73 | | Monthly Target 5 | 75.82 |
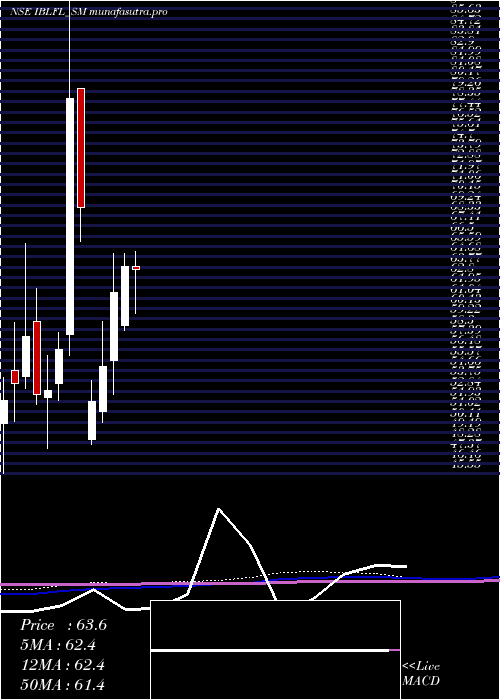
Monthly price and volumes Ibl Finance
| Date |
Closing |
Open |
Range |
Volume |
Tue 28 October 2025 |
67.65 (0.3%) |
67.30 |
60.00 - 69.95 |
0.8081 times |
Tue 30 September 2025 |
67.45 (-3.44%) |
66.40 |
62.35 - 72.80 |
0.7134 times |
Fri 29 August 2025 |
69.85 (9.57%) |
62.50 |
62.50 - 74.00 |
0.7513 times |
Thu 31 July 2025 |
63.75 (-0.08%) |
63.80 |
59.70 - 65.75 |
0.7891 times |
Mon 30 June 2025 |
63.80 (3.66%) |
58.60 |
58.15 - 64.95 |
0.5429 times |
Fri 30 May 2025 |
61.55 (11.91%) |
55.50 |
52.55 - 64.95 |
0.7008 times |
Wed 30 April 2025 |
55.00 (5.87%) |
51.00 |
50.05 - 59.00 |
0.4735 times |
Fri 28 March 2025 |
51.95 (-24.71%) |
48.55 |
48.15 - 53.80 |
0.3851 times |
Mon 07 October 2024 |
69.00 (-12.21%) |
79.50 |
66.00 - 79.50 |
0.3788 times |
Mon 30 September 2024 |
78.60 (39.12%) |
57.85 |
56.00 - 91.70 |
4.4571 times |
Fri 30 August 2024 |
56.50 (6.81%) |
53.50 |
52.00 - 58.00 |
1.4015 times |
DMA SMA EMA moving averages of Ibl Finance IBLFL_SM
DMA (daily moving average) of Ibl Finance IBLFL_SM
| DMA period | DMA value | | 5 day DMA | 67.79 | | 12 day DMA | 68.16 | | 20 day DMA | 67.16 | | 35 day DMA | 67.16 | | 50 day DMA | 66.78 | | 100 day DMA | 64.28 | | 150 day DMA | 63.95 | | 200 day DMA | 61.37 | EMA (exponential moving average) of Ibl Finance IBLFL_SM
| EMA period | EMA current | EMA prev | EMA prev2 | | 5 day EMA | 67.86 | 67.96 | 67.96 | | 12 day EMA | 67.69 | 67.7 | 67.65 | | 20 day EMA | 67.37 | 67.34 | 67.28 | | 35 day EMA | 67.03 | 66.99 | 66.93 | | 50 day EMA | 66.65 | 66.61 | 66.56 |
SMA (simple moving average) of Ibl Finance IBLFL_SM
| SMA period | SMA current | SMA prev | SMA prev2 | | 5 day SMA | 67.79 | 67.56 | 67.73 | | 12 day SMA | 68.16 | 67.76 | 67.53 | | 20 day SMA | 67.16 | 67.13 | 66.94 | | 35 day SMA | 67.16 | 67.25 | 67.34 | | 50 day SMA | 66.78 | 66.71 | 66.67 | | 100 day SMA | 64.28 | 64.14 | 64.01 | | 150 day SMA | 63.95 | 63.88 | 63.81 | | 200 day SMA | 61.37 | 61.31 | 61.24 |
|
|
