Hubtown HUBTOWN full analysis,charts,indicators,moving averages,SMA,DMA,EMA,ADX,MACD,RSIHubtown HUBTOWN WideScreen charts, DMA,SMA,EMA technical analysis, forecast prediction, by indicators ADX,MACD,RSI,CCI NSE stock exchange
operates under Realty sector
Daily price and charts and targets Hubtown Strong Daily Stock price targets for Hubtown HUBTOWN are 295.83 and 302.53 | Daily Target 1 | 294.55 | | Daily Target 2 | 297.1 | | Daily Target 3 | 301.25 | | Daily Target 4 | 303.8 | | Daily Target 5 | 307.95 |
Daily price and volume Hubtown
| Date |
Closing |
Open |
Range |
Volume |
Wed 29 October 2025 |
299.65 (-0.42%) |
303.00 |
298.70 - 305.40 |
0.7472 times |
Tue 28 October 2025 |
300.90 (-0.12%) |
304.75 |
298.05 - 309.00 |
1.3366 times |
Mon 27 October 2025 |
301.25 (-1.34%) |
306.00 |
297.05 - 309.95 |
1.2648 times |
Fri 24 October 2025 |
305.35 (-0.55%) |
310.20 |
302.35 - 310.20 |
1.1179 times |
Thu 23 October 2025 |
307.05 (-1.46%) |
313.00 |
305.00 - 315.90 |
1.4012 times |
Tue 21 October 2025 |
311.60 (1.33%) |
315.00 |
308.75 - 315.00 |
0.4868 times |
Mon 20 October 2025 |
307.50 (-0.66%) |
311.00 |
305.15 - 311.05 |
0.6637 times |
Fri 17 October 2025 |
309.55 (-0.05%) |
312.80 |
307.05 - 312.80 |
0.6575 times |
Thu 16 October 2025 |
309.70 (0.03%) |
308.25 |
307.00 - 314.20 |
1.2998 times |
Wed 15 October 2025 |
309.60 (-0.56%) |
309.10 |
306.25 - 314.40 |
1.0246 times |
Tue 14 October 2025 |
311.35 (1.93%) |
308.70 |
302.15 - 312.00 |
1.2521 times |
Weekly price and charts Hubtown Strong weekly Stock price targets for Hubtown HUBTOWN are 291.9 and 304.8 | Weekly Target 1 | 289.32 | | Weekly Target 2 | 294.48 | | Weekly Target 3 | 302.21666666667 | | Weekly Target 4 | 307.38 | | Weekly Target 5 | 315.12 |
Weekly price and volumes for Hubtown
| Date |
Closing |
Open |
Range |
Volume |
Wed 29 October 2025 |
299.65 (-1.87%) |
306.00 |
297.05 - 309.95 |
0.3583 times |
Fri 24 October 2025 |
305.35 (-1.36%) |
311.00 |
302.35 - 315.90 |
0.3926 times |
Fri 17 October 2025 |
309.55 (-0.34%) |
305.95 |
301.00 - 314.40 |
0.5981 times |
Fri 10 October 2025 |
310.60 (1.26%) |
309.70 |
302.15 - 325.90 |
0.782 times |
Fri 03 October 2025 |
306.75 (5.43%) |
294.00 |
272.80 - 312.55 |
0.986 times |
Fri 26 September 2025 |
290.95 (-10.57%) |
325.30 |
276.50 - 330.70 |
1.5453 times |
Fri 19 September 2025 |
325.35 (-2.21%) |
334.95 |
318.35 - 335.90 |
0.8705 times |
Fri 12 September 2025 |
332.70 (1.82%) |
328.90 |
323.05 - 342.00 |
0.9214 times |
Fri 05 September 2025 |
326.75 (-7.45%) |
354.95 |
318.00 - 362.80 |
1.5177 times |
Fri 29 August 2025 |
353.05 (2.14%) |
346.10 |
341.35 - 365.70 |
2.028 times |
Fri 22 August 2025 |
345.65 (2.1%) |
342.05 |
329.15 - 355.40 |
1.7205 times |
Monthly price and charts Hubtown Strong monthly Stock price targets for Hubtown HUBTOWN are 286.23 and 339.33 | Monthly Target 1 | 246.35 | | Monthly Target 2 | 273 | | Monthly Target 3 | 299.45 | | Monthly Target 4 | 326.1 | | Monthly Target 5 | 352.55 |
Monthly price and volumes Hubtown
| Date |
Closing |
Open |
Range |
Volume |
Wed 29 October 2025 |
299.65 (8.22%) |
279.00 |
272.80 - 325.90 |
0.5632 times |
Tue 30 September 2025 |
276.90 (-21.57%) |
354.95 |
274.85 - 362.80 |
1.0825 times |
Fri 29 August 2025 |
353.05 (5.23%) |
336.50 |
327.40 - 365.70 |
1.5846 times |
Thu 31 July 2025 |
335.50 (24.7%) |
269.90 |
255.75 - 340.70 |
2.5517 times |
Mon 30 June 2025 |
269.04 (51.72%) |
177.33 |
176.05 - 271.93 |
2.7784 times |
Fri 30 May 2025 |
177.33 (-1.38%) |
182.47 |
162.05 - 195.40 |
0.2873 times |
Wed 30 April 2025 |
179.81 (-4.66%) |
185.00 |
178.00 - 221.36 |
0.2991 times |
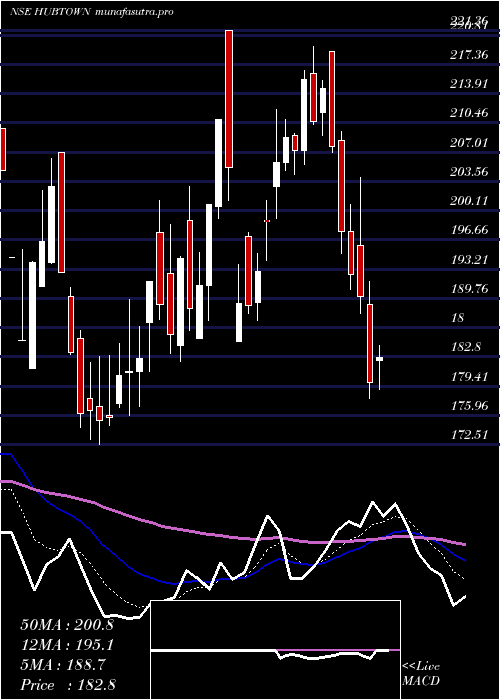
Fri 28 March 2025 |
188.59 (-7.92%) |
194.56 |
172.51 - 207.00 |
0.5786 times |
Fri 28 February 2025 |
204.80 (-25.13%) |
270.00 |
204.80 - 279.00 |
0.1742 times |
Fri 31 January 2025 |
273.55 (4.63%) |
288.00 |
247.95 - 305.00 |
0.1003 times |
Thu 26 December 2024 |
261.45 (-4.09%) |
279.00 |
258.80 - 280.40 |
0.0357 times |
DMA SMA EMA moving averages of Hubtown HUBTOWN
DMA (daily moving average) of Hubtown HUBTOWN
| DMA period | DMA value | | 5 day DMA | 302.84 | | 12 day DMA | 306.58 | | 20 day DMA | 305.56 | | 35 day DMA | 312.84 | | 50 day DMA | 321.89 | | 100 day DMA | 300.6 | | 150 day DMA | 263.39 | | 200 day DMA | 257 | EMA (exponential moving average) of Hubtown HUBTOWN
| EMA period | EMA current | EMA prev | EMA prev2 | | 5 day EMA | 302.54 | 303.99 | 305.53 | | 12 day EMA | 305.34 | 306.38 | 307.38 | | 20 day EMA | 307.9 | 308.77 | 309.6 | | 35 day EMA | 314.8 | 315.69 | 316.56 | | 50 day EMA | 321.62 | 322.52 | 323.4 |
SMA (simple moving average) of Hubtown HUBTOWN
| SMA period | SMA current | SMA prev | SMA prev2 | | 5 day SMA | 302.84 | 305.23 | 306.55 | | 12 day SMA | 306.58 | 307.49 | 307.88 | | 20 day SMA | 305.56 | 304.63 | 304.14 | | 35 day SMA | 312.84 | 313.92 | 314.66 | | 50 day SMA | 321.89 | 322.67 | 323.58 | | 100 day SMA | 300.6 | 299.41 | 298.19 | | 150 day SMA | 263.39 | 262.6 | 261.8 | | 200 day SMA | 257 | 256.22 | 255.43 |
|
|
