HtMedia HTMEDIA_BE full analysis,charts,indicators,moving averages,SMA,DMA,EMA,ADX,MACD,RSIHt Media HTMEDIA_BE WideScreen charts, DMA,SMA,EMA technical analysis, forecast prediction, by indicators ADX,MACD,RSI,CCI NSE stock exchange
Daily price and charts and targets HtMedia Strong Daily Stock price targets for HtMedia HTMEDIA_BE are 26.97 and 28.05 | Daily Target 1 | 26.65 | | Daily Target 2 | 27.28 | | Daily Target 3 | 27.73 | | Daily Target 4 | 28.36 | | Daily Target 5 | 28.81 |
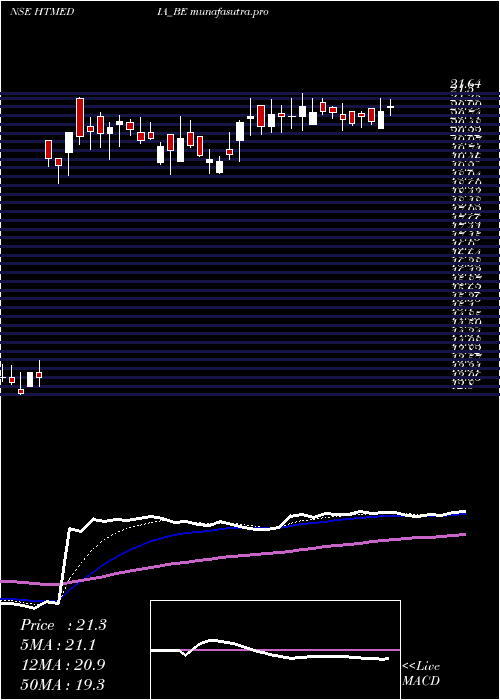
Daily price and volume Ht Media
| Date |
Closing |
Open |
Range |
Volume |
Tue 28 October 2025 |
27.91 (-0.96%) |
28.10 |
27.10 - 28.18 |
2.9546 times |
Mon 27 October 2025 |
28.18 (3.34%) |
26.82 |
26.72 - 28.58 |
1.8462 times |
Fri 24 October 2025 |
27.27 (1.87%) |
26.64 |
26.31 - 28.10 |
0.7727 times |
Thu 23 October 2025 |
26.77 (1.29%) |
26.12 |
26.12 - 26.96 |
1.261 times |
Tue 21 October 2025 |
26.43 (-0.49%) |
27.15 |
26.10 - 27.15 |
0.1285 times |
Mon 20 October 2025 |
26.56 (-0.04%) |
26.02 |
26.02 - 26.79 |
0.4275 times |
Fri 17 October 2025 |
26.57 (-1.19%) |
26.76 |
26.50 - 27.00 |
0.7839 times |
Thu 16 October 2025 |
26.89 (0.41%) |
26.99 |
26.52 - 27.10 |
0.3864 times |
Wed 15 October 2025 |
26.78 (-1.44%) |
27.10 |
26.20 - 27.60 |
0.6619 times |
Tue 14 October 2025 |
27.17 (-0.29%) |
27.25 |
26.82 - 28.25 |
0.7774 times |
Mon 13 October 2025 |
27.25 (-1.38%) |
27.63 |
27.00 - 27.95 |
0.4142 times |
Weekly price and charts HtMedia Strong weekly Stock price targets for HtMedia HTMEDIA_BE are 27.32 and 29.18 | Weekly Target 1 | 25.88 | | Weekly Target 2 | 26.89 | | Weekly Target 3 | 27.736666666667 | | Weekly Target 4 | 28.75 | | Weekly Target 5 | 29.6 |
Weekly price and volumes for Ht Media
| Date |
Closing |
Open |
Range |
Volume |
Tue 28 October 2025 |
27.91 (2.35%) |
26.82 |
26.72 - 28.58 |
1.2149 times |
Fri 24 October 2025 |
27.27 (2.63%) |
26.02 |
26.02 - 28.10 |
0.6553 times |
Fri 17 October 2025 |
26.57 (-3.84%) |
27.63 |
26.20 - 28.25 |
0.7652 times |
Fri 10 October 2025 |
27.63 (1.21%) |
27.00 |
26.51 - 28.64 |
1.1107 times |
Fri 03 October 2025 |
27.30 (1.34%) |
26.99 |
26.20 - 27.60 |
1.0489 times |
Fri 26 September 2025 |
26.94 (0.67%) |
27.00 |
26.03 - 27.40 |
1.3133 times |
Fri 19 September 2025 |
26.76 (0.49%) |
26.89 |
26.01 - 27.00 |
1.1481 times |
Fri 12 September 2025 |
26.63 (1.72%) |
26.50 |
25.52 - 26.85 |
0.9102 times |
Fri 05 September 2025 |
26.18 (5.18%) |
24.32 |
24.32 - 26.50 |
1.0008 times |
Fri 29 August 2025 |
24.89 (-1.97%) |
25.49 |
24.50 - 25.88 |
0.8325 times |
Fri 22 August 2025 |
25.39 (2.59%) |
25.00 |
24.30 - 26.00 |
1.5756 times |
Monthly price and charts HtMedia Strong monthly Stock price targets for HtMedia HTMEDIA_BE are 26.97 and 29.59 | Monthly Target 1 | 24.9 | | Monthly Target 2 | 26.41 | | Monthly Target 3 | 27.523333333333 | | Monthly Target 4 | 29.03 | | Monthly Target 5 | 30.14 |
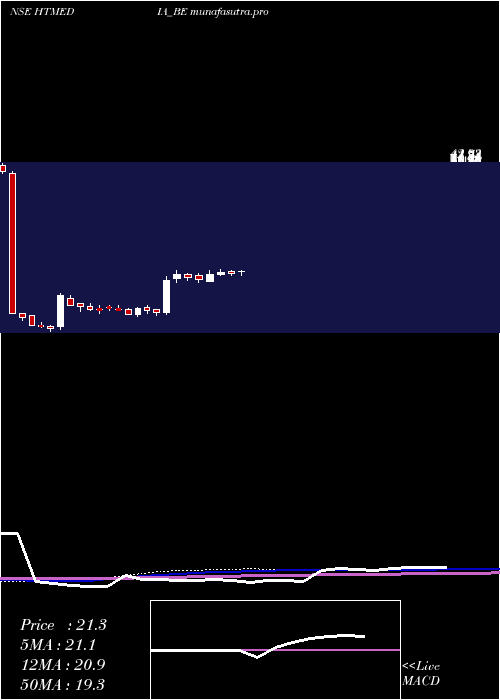
Monthly price and volumes Ht Media
| Date |
Closing |
Open |
Range |
Volume |
Tue 28 October 2025 |
27.91 (3.49%) |
26.97 |
26.02 - 28.64 |
1.1342 times |
Tue 30 September 2025 |
26.97 (8.36%) |
24.32 |
24.32 - 27.48 |
1.3746 times |
Fri 29 August 2025 |
24.89 (3.97%) |
24.25 |
22.25 - 26.00 |
2.3216 times |
Thu 31 July 2025 |
23.94 (13.95%) |
21.05 |
20.50 - 24.65 |
2.4546 times |
Mon 30 June 2025 |
21.01 (7.58%) |
19.90 |
19.25 - 21.52 |
1.6464 times |
Fri 30 May 2025 |
19.53 (46.84%) |
20.25 |
19.00 - 20.25 |
0.1024 times |
Mon 09 November 2020 |
13.30 (-3.62%) |
14.00 |
12.80 - 14.00 |
0.0495 times |
Fri 30 October 2020 |
13.80 (-3.16%) |
14.25 |
12.70 - 14.80 |
0.3151 times |
Wed 30 September 2020 |
14.25 (-10.38%) |
15.20 |
13.20 - 16.00 |
0.443 times |
Mon 31 August 2020 |
15.90 (51.43%) |
16.85 |
15.90 - 17.05 |
0.1586 times |
Tue 26 May 2020 |
10.50 (-15.32%) |
12.95 |
9.75 - 12.95 |
0.1701 times |

DMA SMA EMA moving averages of Ht Media HTMEDIA_BE
DMA (daily moving average) of Ht Media HTMEDIA_BE
| DMA period | DMA value | | 5 day DMA | 27.31 | | 12 day DMA | 27.12 | | 20 day DMA | 27.18 | | 35 day DMA | 26.9 | | 50 day DMA | 26.45 | | 100 day DMA | 24.18 | | 150 day DMA | 20.97 | | 200 day DMA | | EMA (exponential moving average) of Ht Media HTMEDIA_BE
| EMA period | EMA current | EMA prev | EMA prev2 | | 5 day EMA | 27.52 | 27.32 | 26.89 | | 12 day EMA | 27.23 | 27.11 | 26.91 | | 20 day EMA | 27.08 | 26.99 | 26.86 | | 35 day EMA | 26.72 | 26.65 | 26.56 | | 50 day EMA | 26.37 | 26.31 | 26.23 |
SMA (simple moving average) of Ht Media HTMEDIA_BE
| SMA period | SMA current | SMA prev | SMA prev2 | | 5 day SMA | 27.31 | 27.04 | 26.72 | | 12 day SMA | 27.12 | 27.07 | 26.98 | | 20 day SMA | 27.18 | 27.13 | 27.05 | | 35 day SMA | 26.9 | 26.85 | 26.79 | | 50 day SMA | 26.45 | 26.38 | 26.32 | | 100 day SMA | 24.18 | 24.1 | 24.02 | | 150 day SMA | 20.97 | 20.88 | 20.8 | | 200 day SMA |
|
|
