HplElectric HPL full analysis,charts,indicators,moving averages,SMA,DMA,EMA,ADX,MACD,RSIHpl Electric HPL WideScreen charts, DMA,SMA,EMA technical analysis, forecast prediction, by indicators ADX,MACD,RSI,CCI NSE stock exchange
Daily price and charts and targets HplElectric Strong Daily Stock price targets for HplElectric HPL are 441.05 and 457.35 | Daily Target 1 | 428.18 | | Daily Target 2 | 437.62 | | Daily Target 3 | 444.48333333333 | | Daily Target 4 | 453.92 | | Daily Target 5 | 460.78 |
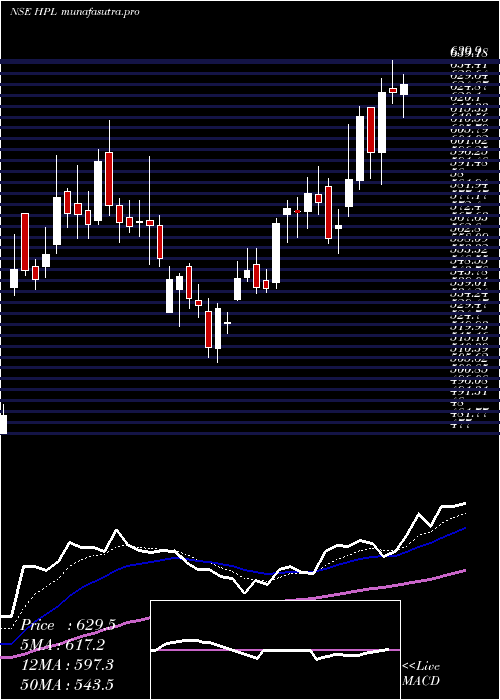
Daily price and volume Hpl Electric
| Date |
Closing |
Open |
Range |
Volume |
Wed 29 October 2025 |
447.05 (2.19%) |
437.00 |
435.05 - 451.35 |
1.3304 times |
Tue 28 October 2025 |
437.45 (-0.39%) |
440.00 |
436.10 - 442.50 |
0.6017 times |
Mon 27 October 2025 |
439.15 (-1.34%) |
445.80 |
433.50 - 447.00 |
1.8254 times |
Fri 24 October 2025 |
445.10 (0.47%) |
443.00 |
439.50 - 449.75 |
0.6343 times |
Thu 23 October 2025 |
443.00 (-1.73%) |
458.80 |
441.35 - 458.80 |
0.8844 times |
Tue 21 October 2025 |
450.80 (0.55%) |
449.10 |
449.00 - 457.65 |
0.3771 times |
Mon 20 October 2025 |
448.35 (1.23%) |
442.90 |
438.55 - 451.90 |
0.7409 times |
Fri 17 October 2025 |
442.90 (-2.12%) |
452.50 |
441.20 - 452.50 |
1.1474 times |
Thu 16 October 2025 |
452.50 (4.38%) |
435.65 |
434.30 - 455.00 |
1.682 times |
Wed 15 October 2025 |
433.50 (0.66%) |
434.55 |
427.95 - 437.00 |
0.7763 times |
Tue 14 October 2025 |
430.65 (-1.79%) |
437.15 |
428.55 - 441.65 |
1.0199 times |
Weekly price and charts HplElectric Strong weekly Stock price targets for HplElectric HPL are 440.28 and 458.13 | Weekly Target 1 | 426.12 | | Weekly Target 2 | 436.58 | | Weekly Target 3 | 443.96666666667 | | Weekly Target 4 | 454.43 | | Weekly Target 5 | 461.82 |
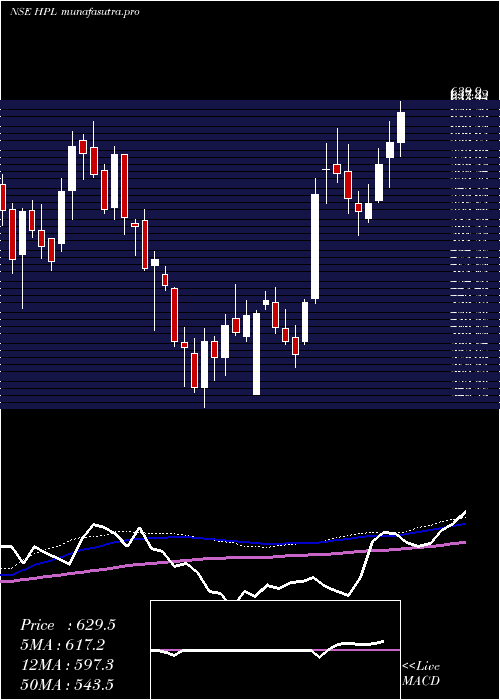
Weekly price and volumes for Hpl Electric
| Date |
Closing |
Open |
Range |
Volume |
Wed 29 October 2025 |
447.05 (0.44%) |
445.80 |
433.50 - 451.35 |
0.6969 times |
Fri 24 October 2025 |
445.10 (0.5%) |
442.90 |
438.55 - 458.80 |
0.489 times |
Fri 17 October 2025 |
442.90 (-0.59%) |
445.00 |
427.95 - 455.00 |
1.0542 times |
Fri 10 October 2025 |
445.55 (-4.93%) |
472.70 |
441.05 - 472.70 |
1.0737 times |
Fri 03 October 2025 |
468.65 (1.1%) |
467.20 |
450.30 - 474.90 |
0.6109 times |
Fri 26 September 2025 |
463.55 (-4.24%) |
483.95 |
460.10 - 505.00 |
1.3202 times |
Fri 19 September 2025 |
484.05 (-1.38%) |
493.75 |
474.95 - 507.90 |
1.1811 times |
Fri 12 September 2025 |
490.80 (5.41%) |
461.25 |
461.25 - 495.00 |
1.3262 times |
Fri 05 September 2025 |
465.60 (-0.02%) |
471.90 |
463.95 - 484.95 |
0.9004 times |
Fri 29 August 2025 |
465.70 (-5.13%) |
494.85 |
457.00 - 496.00 |
1.3474 times |
Fri 22 August 2025 |
490.90 (1.53%) |
484.95 |
472.00 - 517.75 |
2.976 times |
Monthly price and charts HplElectric Strong monthly Stock price targets for HplElectric HPL are 414.03 and 460.98 | Monthly Target 1 | 403.02 | | Monthly Target 2 | 425.03 | | Monthly Target 3 | 449.96666666667 | | Monthly Target 4 | 471.98 | | Monthly Target 5 | 496.92 |
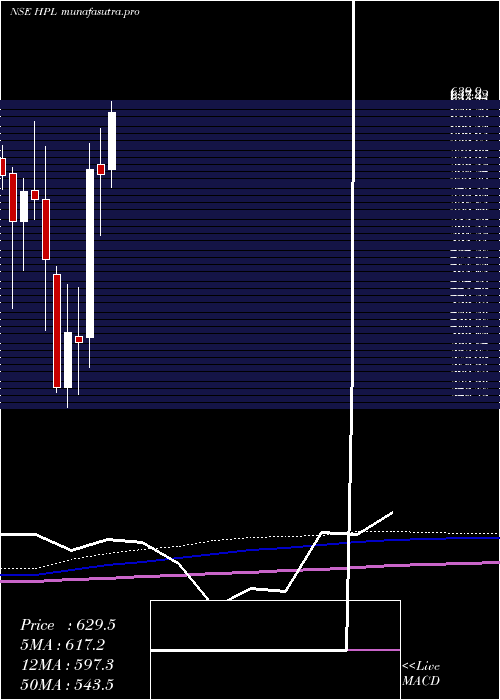
Monthly price and volumes Hpl Electric
| Date |
Closing |
Open |
Range |
Volume |
Wed 29 October 2025 |
447.05 (-1.99%) |
456.70 |
427.95 - 474.90 |
0.3262 times |
Tue 30 September 2025 |
456.15 (-2.05%) |
471.90 |
450.30 - 507.90 |
0.454 times |
Fri 29 August 2025 |
465.70 (-18.52%) |
572.00 |
457.00 - 607.45 |
1.1854 times |
Thu 31 July 2025 |
571.55 (0.52%) |
572.90 |
537.40 - 639.90 |
2.0643 times |
Mon 30 June 2025 |
568.60 (-0.78%) |
577.65 |
508.00 - 613.65 |
0.9829 times |
Fri 30 May 2025 |
573.05 (42.11%) |
408.00 |
378.00 - 598.40 |
1.9569 times |
Wed 30 April 2025 |
403.25 (-2.35%) |
408.70 |
352.05 - 457.10 |
0.6352 times |
Fri 28 March 2025 |
412.95 (15.25%) |
358.30 |
339.00 - 459.90 |
0.9553 times |
Fri 28 February 2025 |
358.30 (-26.04%) |
470.00 |
354.00 - 477.35 |
0.527 times |
Fri 31 January 2025 |
484.45 (-10.86%) |
544.00 |
414.70 - 596.05 |
0.9129 times |
Tue 31 December 2024 |
543.50 (-1.48%) |
552.00 |
524.00 - 619.90 |
1.4198 times |
DMA SMA EMA moving averages of Hpl Electric HPL
DMA (daily moving average) of Hpl Electric HPL
| DMA period | DMA value | | 5 day DMA | 442.35 | | 12 day DMA | 442.41 | | 20 day DMA | 447.88 | | 35 day DMA | 460.34 | | 50 day DMA | 465.89 | | 100 day DMA | 517.6 | | 150 day DMA | 497.12 | | 200 day DMA | 482.34 | EMA (exponential moving average) of Hpl Electric HPL
| EMA period | EMA current | EMA prev | EMA prev2 | | 5 day EMA | 443.27 | 441.38 | 443.34 | | 12 day EMA | 445.21 | 444.88 | 446.23 | | 20 day EMA | 449.85 | 450.15 | 451.49 | | 35 day EMA | 459.92 | 460.68 | 462.05 | | 50 day EMA | 471.13 | 472.11 | 473.52 |
SMA (simple moving average) of Hpl Electric HPL
| SMA period | SMA current | SMA prev | SMA prev2 | | 5 day SMA | 442.35 | 443.1 | 445.28 | | 12 day SMA | 442.41 | 442.29 | 442.88 | | 20 day SMA | 447.88 | 448.21 | 449.52 | | 35 day SMA | 460.34 | 460.88 | 461.68 | | 50 day SMA | 465.89 | 466.62 | 469.72 | | 100 day SMA | 517.6 | 518.89 | 520.47 | | 150 day SMA | 497.12 | 496.89 | 496.71 | | 200 day SMA | 482.34 | 482.89 | 483.45 |
|
|
