GoldmanSachs HNGSNGBEES full analysis,charts,indicators,moving averages,SMA,DMA,EMA,ADX,MACD,RSIGoldman Sachs HNGSNGBEES WideScreen charts, DMA,SMA,EMA technical analysis, forecast prediction, by indicators ADX,MACD,RSI,CCI NSE stock exchange
Daily price and charts and targets GoldmanSachs Strong Daily Stock price targets for GoldmanSachs HNGSNGBEES are 522.99 and 528.45 | Daily Target 1 | 518.44 | | Daily Target 2 | 522.08 | | Daily Target 3 | 523.9 | | Daily Target 4 | 527.54 | | Daily Target 5 | 529.36 |
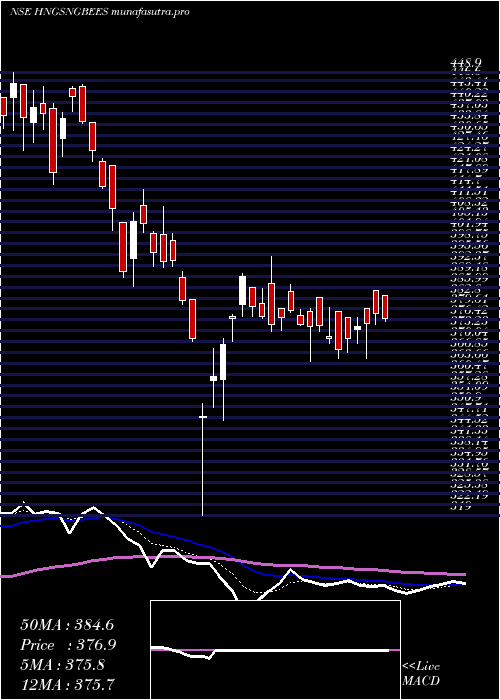
Daily price and volume Goldman Sachs
| Date |
Closing |
Open |
Range |
Volume |
Wed 29 October 2025 |
525.72 (1.55%) |
522.87 |
520.26 - 525.72 |
1.2164 times |
Tue 28 October 2025 |
517.69 (0.67%) |
517.69 |
517.69 - 517.69 |
0.3707 times |
Mon 27 October 2025 |
514.22 (0.39%) |
514.22 |
514.22 - 514.22 |
0.4348 times |
Fri 24 October 2025 |
512.23 (0%) |
512.23 |
512.23 - 512.23 |
0.6291 times |
Thu 23 October 2025 |
512.23 (2.25%) |
509.10 |
505.52 - 512.23 |
0.9053 times |
Tue 21 October 2025 |
500.98 (-2.28%) |
500.98 |
500.98 - 500.98 |
0.5106 times |
Mon 20 October 2025 |
512.68 (1.92%) |
508.06 |
503.74 - 512.68 |
0.9829 times |
Fri 17 October 2025 |
503.03 (-1.14%) |
513.79 |
498.00 - 513.79 |
2.4286 times |
Thu 16 October 2025 |
508.82 (-1.58%) |
508.82 |
508.82 - 508.82 |
1.5919 times |
Wed 15 October 2025 |
516.98 (-1.38%) |
516.98 |
510.00 - 516.98 |
0.9297 times |
Tue 14 October 2025 |
524.23 (-0.97%) |
524.00 |
520.25 - 524.80 |
1.1746 times |
Weekly price and charts GoldmanSachs Strong weekly Stock price targets for GoldmanSachs HNGSNGBEES are 519.97 and 531.47 | Weekly Target 1 | 510.39 | | Weekly Target 2 | 518.05 | | Weekly Target 3 | 521.88666666667 | | Weekly Target 4 | 529.55 | | Weekly Target 5 | 533.39 |
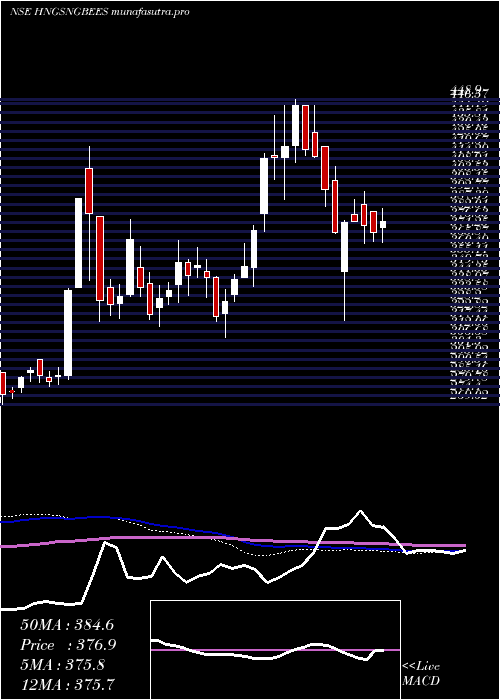
Weekly price and volumes for Goldman Sachs
| Date |
Closing |
Open |
Range |
Volume |
Wed 29 October 2025 |
525.72 (2.63%) |
514.22 |
514.22 - 525.72 |
0.2729 times |
Fri 24 October 2025 |
512.23 (1.83%) |
508.06 |
500.98 - 512.68 |
0.4088 times |
Fri 17 October 2025 |
503.03 (-6.11%) |
520.00 |
498.00 - 534.66 |
1.4494 times |
Fri 10 October 2025 |
535.76 (-0.21%) |
536.88 |
535.76 - 579.92 |
1.3161 times |
Fri 03 October 2025 |
536.88 (2.03%) |
528.90 |
521.89 - 536.88 |
0.3738 times |
Fri 26 September 2025 |
526.19 (0.02%) |
526.63 |
518.00 - 529.80 |
0.7821 times |
Fri 19 September 2025 |
526.07 (1.71%) |
518.71 |
505.15 - 529.49 |
1.3815 times |
Fri 12 September 2025 |
517.23 (7.22%) |
487.20 |
479.39 - 518.78 |
1.3225 times |
Fri 05 September 2025 |
482.38 (3.85%) |
474.84 |
463.00 - 486.94 |
1.4337 times |
Fri 29 August 2025 |
464.51 (2.57%) |
453.79 |
451.30 - 471.00 |
1.2591 times |
Fri 22 August 2025 |
452.88 (-1.97%) |
465.69 |
436.94 - 471.90 |
1.2941 times |
Monthly price and charts GoldmanSachs Strong monthly Stock price targets for GoldmanSachs HNGSNGBEES are 470.9 and 552.82 | Monthly Target 1 | 452.63 | | Monthly Target 2 | 489.17 | | Monthly Target 3 | 534.54666666667 | | Monthly Target 4 | 571.09 | | Monthly Target 5 | 616.47 |
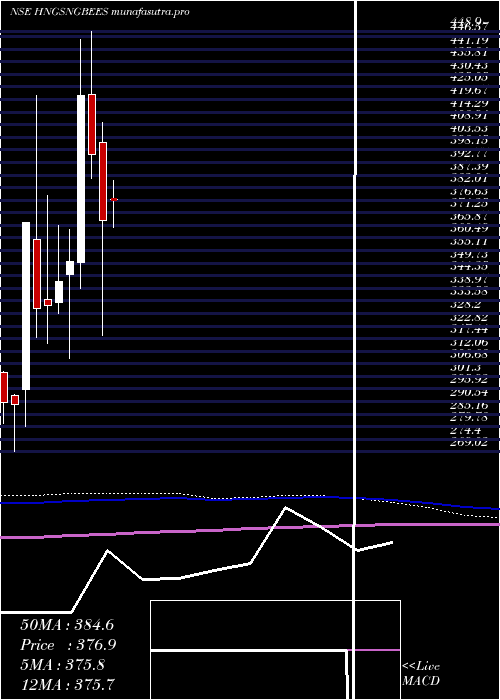
Monthly price and volumes Goldman Sachs
| Date |
Closing |
Open |
Range |
Volume |
Wed 29 October 2025 |
525.72 (0.73%) |
531.78 |
498.00 - 579.92 |
0.7175 times |
Tue 30 September 2025 |
521.89 (12.35%) |
474.84 |
463.00 - 529.80 |
0.9979 times |
Fri 29 August 2025 |
464.51 (8.87%) |
430.93 |
412.23 - 471.90 |
0.9785 times |
Thu 31 July 2025 |
426.66 (11%) |
393.00 |
380.00 - 447.89 |
1.1115 times |
Mon 30 June 2025 |
384.37 (-0.71%) |
394.98 |
375.05 - 394.98 |
0.4889 times |
Fri 30 May 2025 |
387.12 (5.25%) |
377.00 |
365.00 - 405.64 |
0.693 times |
Wed 30 April 2025 |
367.80 (-7.14%) |
401.45 |
319.00 - 409.80 |
1.0653 times |
Fri 28 March 2025 |
396.09 (-6.02%) |
422.00 |
386.09 - 448.90 |
1.469 times |
Fri 28 February 2025 |
421.44 (20.27%) |
349.99 |
339.00 - 445.50 |
1.7948 times |
Fri 31 January 2025 |
350.40 (2.44%) |
344.66 |
309.05 - 364.15 |
0.6835 times |
Tue 31 December 2024 |
342.06 (3.14%) |
333.00 |
328.21 - 366.00 |
0.7869 times |
DMA SMA EMA moving averages of Goldman Sachs HNGSNGBEES
DMA (daily moving average) of Goldman Sachs HNGSNGBEES
| DMA period | DMA value | | 5 day DMA | 516.42 | | 12 day DMA | 514.85 | | 20 day DMA | 524.85 | | 35 day DMA | 522.64 | | 50 day DMA | 505.25 | | 100 day DMA | 454.14 | | 150 day DMA | 431.06 | | 200 day DMA | 419.76 | EMA (exponential moving average) of Goldman Sachs HNGSNGBEES
| EMA period | EMA current | EMA prev | EMA prev2 | | 5 day EMA | 517.93 | 514.03 | 512.2 | | 12 day EMA | 517.99 | 516.58 | 516.38 | | 20 day EMA | 518.26 | 517.47 | 517.45 | | 35 day EMA | 510.01 | 509.08 | 508.57 | | 50 day EMA | 501.17 | 500.17 | 499.46 |
SMA (simple moving average) of Goldman Sachs HNGSNGBEES
| SMA period | SMA current | SMA prev | SMA prev2 | | 5 day SMA | 516.42 | 511.47 | 510.47 | | 12 day SMA | 514.85 | 515.69 | 518.23 | | 20 day SMA | 524.85 | 525.01 | 525.44 | | 35 day SMA | 522.64 | 521.63 | 520.62 | | 50 day SMA | 505.25 | 503.98 | 502.53 | | 100 day SMA | 454.14 | 452.75 | 451.44 | | 150 day SMA | 431.06 | 430.4 | 429.84 | | 200 day SMA | 419.76 | 418.81 | 417.89 |
|
|
