HindustanFoods HNDFDS full analysis,charts,indicators,moving averages,SMA,DMA,EMA,ADX,MACD,RSIHindustan Foods HNDFDS WideScreen charts, DMA,SMA,EMA technical analysis, forecast prediction, by indicators ADX,MACD,RSI,CCI NSE stock exchange
Daily price and charts and targets HindustanFoods Strong Daily Stock price targets for HindustanFoods HNDFDS are 514.5 and 521.45 | Daily Target 1 | 513.02 | | Daily Target 2 | 515.98 | | Daily Target 3 | 519.96666666667 | | Daily Target 4 | 522.93 | | Daily Target 5 | 526.92 |
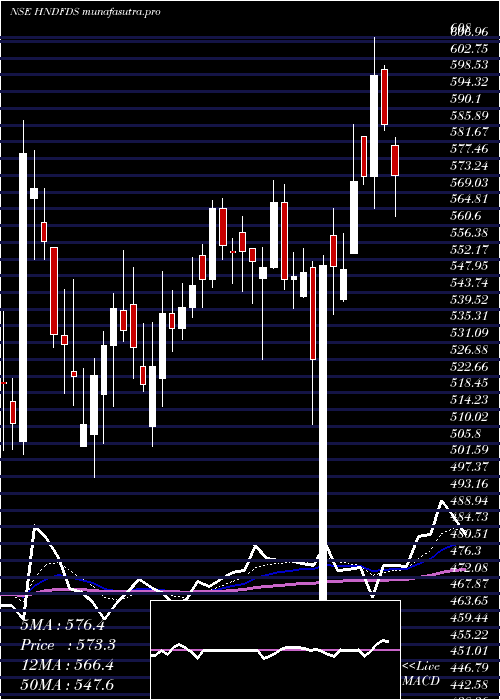
Daily price and volume Hindustan Foods
| Date |
Closing |
Open |
Range |
Volume |
Tue 28 October 2025 |
518.95 (0.14%) |
520.30 |
517.00 - 523.95 |
0.2841 times |
Mon 27 October 2025 |
518.25 (-0.58%) |
521.25 |
515.00 - 523.95 |
0.7791 times |
Fri 24 October 2025 |
521.25 (0.05%) |
523.10 |
517.05 - 523.25 |
1.013 times |
Thu 23 October 2025 |
521.00 (-1.2%) |
527.35 |
519.60 - 528.40 |
1.2409 times |
Tue 21 October 2025 |
527.35 (1.29%) |
529.70 |
521.00 - 530.00 |
0.432 times |
Mon 20 October 2025 |
520.65 (0.02%) |
524.90 |
516.30 - 524.90 |
0.4573 times |
Fri 17 October 2025 |
520.55 (-1.28%) |
525.10 |
519.70 - 530.10 |
0.9606 times |
Thu 16 October 2025 |
527.30 (1.04%) |
527.15 |
522.80 - 530.95 |
0.8826 times |
Wed 15 October 2025 |
521.85 (-2.12%) |
526.30 |
513.60 - 531.25 |
1.8374 times |
Tue 14 October 2025 |
533.15 (1.4%) |
525.85 |
518.35 - 536.00 |
2.113 times |
Mon 13 October 2025 |
525.80 (0%) |
528.10 |
522.00 - 529.20 |
0.5622 times |
Weekly price and charts HindustanFoods Strong weekly Stock price targets for HindustanFoods HNDFDS are 512.5 and 521.45 | Weekly Target 1 | 510.35 | | Weekly Target 2 | 514.65 | | Weekly Target 3 | 519.3 | | Weekly Target 4 | 523.6 | | Weekly Target 5 | 528.25 |
Weekly price and volumes for Hindustan Foods
| Date |
Closing |
Open |
Range |
Volume |
Tue 28 October 2025 |
518.95 (-0.44%) |
521.25 |
515.00 - 523.95 |
0.253 times |
Fri 24 October 2025 |
521.25 (0.13%) |
524.90 |
516.30 - 530.00 |
0.7478 times |
Fri 17 October 2025 |
520.55 (-1%) |
528.10 |
513.60 - 536.00 |
1.5121 times |
Fri 10 October 2025 |
525.80 (-1.56%) |
534.15 |
521.00 - 554.15 |
0.9684 times |
Fri 03 October 2025 |
534.15 (1.18%) |
527.90 |
517.30 - 539.90 |
0.6726 times |
Fri 26 September 2025 |
527.90 (-4.02%) |
550.05 |
525.05 - 558.30 |
0.8809 times |
Fri 19 September 2025 |
550.00 (3.33%) |
532.30 |
527.00 - 559.00 |
1.6918 times |
Fri 12 September 2025 |
532.25 (-1.08%) |
540.90 |
529.80 - 542.35 |
0.9591 times |
Fri 05 September 2025 |
538.05 (2.53%) |
520.15 |
519.95 - 555.00 |
1.3828 times |
Fri 29 August 2025 |
524.75 (-0.77%) |
528.80 |
516.10 - 536.35 |
0.9314 times |
Fri 22 August 2025 |
528.80 (1.98%) |
538.80 |
525.45 - 539.20 |
1.2418 times |

Monthly price and charts HindustanFoods Strong monthly Stock price targets for HindustanFoods HNDFDS are 496 and 536.55 | Monthly Target 1 | 488.35 | | Monthly Target 2 | 503.65 | | Monthly Target 3 | 528.9 | | Monthly Target 4 | 544.2 | | Monthly Target 5 | 569.45 |
Monthly price and volumes Hindustan Foods
| Date |
Closing |
Open |
Range |
Volume |
Tue 28 October 2025 |
518.95 (-0.36%) |
520.85 |
513.60 - 554.15 |
0.4543 times |
Tue 30 September 2025 |
520.80 (-0.75%) |
520.15 |
517.30 - 559.00 |
0.634 times |
Fri 29 August 2025 |
524.75 (-4.98%) |
552.25 |
509.80 - 572.00 |
0.6079 times |
Thu 31 July 2025 |
552.25 (2.88%) |
536.80 |
528.85 - 584.90 |
1.5132 times |
Mon 30 June 2025 |
536.80 (-1.96%) |
545.00 |
522.40 - 548.35 |
0.9094 times |
Fri 30 May 2025 |
547.55 (2.32%) |
530.00 |
493.60 - 578.45 |
1.8887 times |
Wed 30 April 2025 |
535.15 (-5.51%) |
566.35 |
421.50 - 608.00 |
0.983 times |
Fri 28 March 2025 |
566.35 (10.96%) |
508.00 |
497.05 - 571.90 |
0.9127 times |
Fri 28 February 2025 |
510.40 (0.71%) |
540.00 |
503.05 - 592.90 |
1.2921 times |
Fri 31 January 2025 |
506.80 (-1.93%) |
516.80 |
464.00 - 527.30 |
0.8048 times |
Tue 31 December 2024 |
516.80 (-6.78%) |
549.05 |
508.80 - 592.80 |
1.4745 times |

DMA SMA EMA moving averages of Hindustan Foods HNDFDS
DMA (daily moving average) of Hindustan Foods HNDFDS
| DMA period | DMA value | | 5 day DMA | 521.36 | | 12 day DMA | 523.49 | | 20 day DMA | 526.87 | | 35 day DMA | 532.5 | | 50 day DMA | 531.71 | | 100 day DMA | 538.92 | | 150 day DMA | 541.1 | | 200 day DMA | 536.16 | EMA (exponential moving average) of Hindustan Foods HNDFDS
| EMA period | EMA current | EMA prev | EMA prev2 | | 5 day EMA | 520.49 | 521.26 | 522.77 | | 12 day EMA | 523.52 | 524.35 | 525.46 | | 20 day EMA | 526.13 | 526.88 | 527.79 | | 35 day EMA | 527.99 | 528.52 | 529.12 | | 50 day EMA | 530.12 | 530.58 | 531.08 |
SMA (simple moving average) of Hindustan Foods HNDFDS
| SMA period | SMA current | SMA prev | SMA prev2 | | 5 day SMA | 521.36 | 521.7 | 522.16 | | 12 day SMA | 523.49 | 524.04 | 525.05 | | 20 day SMA | 526.87 | 527.32 | 528.15 | | 35 day SMA | 532.5 | 533.05 | 533.75 | | 50 day SMA | 531.71 | 531.62 | 531.63 | | 100 day SMA | 538.92 | 539.03 | 539.15 | | 150 day SMA | 541.1 | 541.28 | 541.47 | | 200 day SMA | 536.16 | 536.12 | 536.12 |
|
|
