HitechCorporation HITECHCORP full analysis,charts,indicators,moving averages,SMA,DMA,EMA,ADX,MACD,RSIHitech Corporation HITECHCORP WideScreen charts, DMA,SMA,EMA technical analysis, forecast prediction, by indicators ADX,MACD,RSI,CCI NSE stock exchange
operates under Containers & Packaging sector
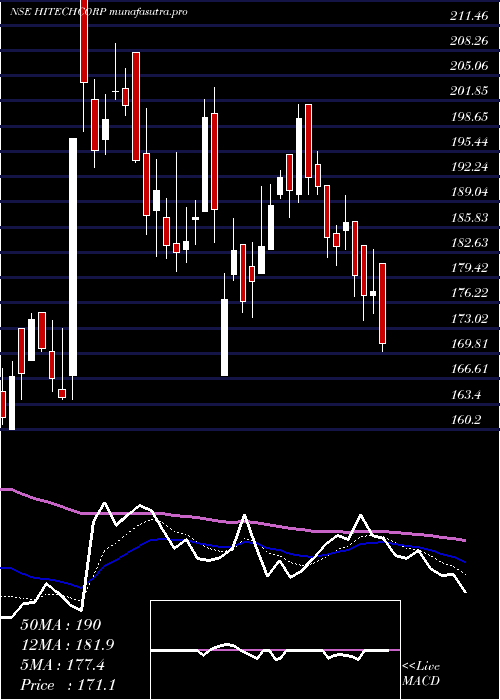
Daily price and charts and targets HitechCorporation Strong Daily Stock price targets for HitechCorporation HITECHCORP are 184.8 and 187.72 | Daily Target 1 | 182.42 | | Daily Target 2 | 184.25 | | Daily Target 3 | 185.33666666667 | | Daily Target 4 | 187.17 | | Daily Target 5 | 188.26 |
Daily price and volume Hitech Corporation
| Date |
Closing |
Open |
Range |
Volume |
Wed 29 October 2025 |
186.09 (0.25%) |
183.50 |
183.50 - 186.42 |
0.8326 times |
Tue 28 October 2025 |
185.63 (-1%) |
191.00 |
183.37 - 191.00 |
1.1168 times |
Mon 27 October 2025 |
187.51 (0.28%) |
188.25 |
186.47 - 188.38 |
0.2858 times |
Fri 24 October 2025 |
186.98 (-1.08%) |
189.20 |
186.31 - 189.20 |
0.4764 times |
Thu 23 October 2025 |
189.02 (-0.91%) |
188.00 |
186.32 - 194.01 |
1.5682 times |
Tue 21 October 2025 |
190.76 (3.49%) |
189.90 |
185.12 - 194.86 |
0.4552 times |
Mon 20 October 2025 |
184.32 (-2.26%) |
187.95 |
182.50 - 191.06 |
1.904 times |
Fri 17 October 2025 |
188.59 (-1.5%) |
191.11 |
188.00 - 191.11 |
0.3634 times |
Thu 16 October 2025 |
191.46 (3.63%) |
187.18 |
185.65 - 192.19 |
1.7037 times |
Wed 15 October 2025 |
184.75 (-0.21%) |
186.09 |
183.00 - 188.05 |
1.2939 times |
Tue 14 October 2025 |
185.13 (-1.02%) |
188.89 |
183.41 - 188.89 |
0.9451 times |
Weekly price and charts HitechCorporation Strong weekly Stock price targets for HitechCorporation HITECHCORP are 180.92 and 188.55 | Weekly Target 1 | 179.19 | | Weekly Target 2 | 182.64 | | Weekly Target 3 | 186.82 | | Weekly Target 4 | 190.27 | | Weekly Target 5 | 194.45 |
Weekly price and volumes for Hitech Corporation
| Date |
Closing |
Open |
Range |
Volume |
Wed 29 October 2025 |
186.09 (-0.48%) |
188.25 |
183.37 - 191.00 |
0.1961 times |
Fri 24 October 2025 |
186.98 (-0.85%) |
187.95 |
182.50 - 194.86 |
0.3863 times |
Fri 17 October 2025 |
188.59 (-4.06%) |
197.90 |
183.00 - 197.90 |
0.776 times |
Fri 10 October 2025 |
196.57 (-1.9%) |
202.20 |
186.13 - 202.20 |
0.9599 times |
Fri 03 October 2025 |
200.38 (4.87%) |
193.99 |
186.60 - 203.80 |
1.9225 times |
Fri 26 September 2025 |
191.08 (-6.93%) |
205.31 |
185.10 - 206.95 |
0.5597 times |
Fri 19 September 2025 |
205.31 (0.62%) |
206.90 |
199.57 - 210.00 |
1.0185 times |
Fri 12 September 2025 |
204.05 (0.44%) |
201.00 |
196.50 - 223.44 |
2.3934 times |
Fri 05 September 2025 |
203.15 (2.42%) |
200.46 |
190.81 - 209.90 |
1.0874 times |
Fri 29 August 2025 |
198.35 (-2.12%) |
201.00 |
196.30 - 212.00 |
0.7003 times |
Fri 22 August 2025 |
202.65 (-0.16%) |
202.50 |
191.21 - 212.94 |
1.5182 times |
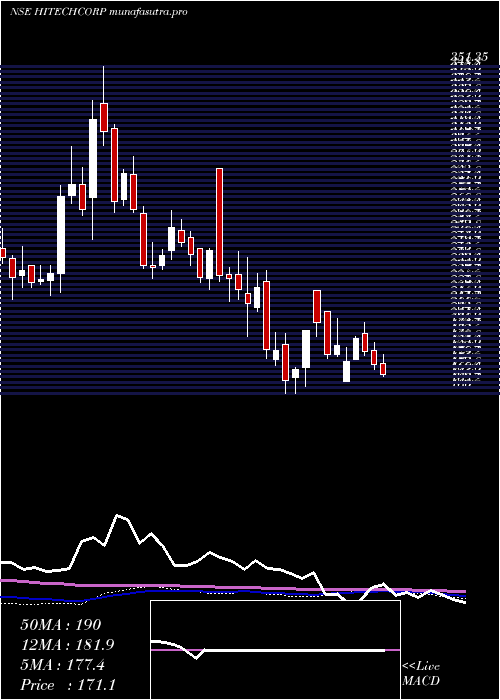
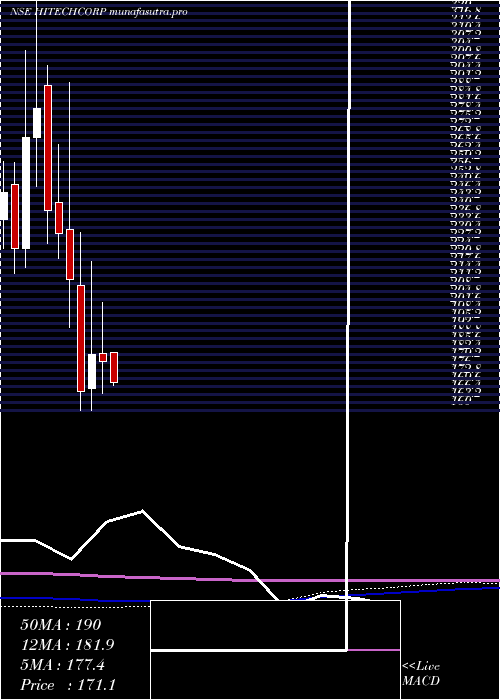
Monthly price and charts HitechCorporation Strong monthly Stock price targets for HitechCorporation HITECHCORP are 173.65 and 194.95 | Monthly Target 1 | 169.5 | | Monthly Target 2 | 177.79 | | Monthly Target 3 | 190.79666666667 | | Monthly Target 4 | 199.09 | | Monthly Target 5 | 212.1 |
Monthly price and volumes Hitech Corporation
| Date |
Closing |
Open |
Range |
Volume |
Wed 29 October 2025 |
186.09 (-1.57%) |
193.25 |
182.50 - 203.80 |
0.5248 times |
Tue 30 September 2025 |
189.06 (-4.68%) |
200.46 |
185.10 - 223.44 |
0.8168 times |
Fri 29 August 2025 |
198.35 (6.57%) |
187.49 |
177.60 - 217.90 |
1.0231 times |
Thu 31 July 2025 |
186.12 (-7.03%) |
203.90 |
184.30 - 220.01 |
0.8456 times |
Mon 30 June 2025 |
200.20 (7.94%) |
189.99 |
177.00 - 207.95 |
0.9786 times |
Fri 30 May 2025 |
185.48 (3.19%) |
183.50 |
166.01 - 199.49 |
0.4294 times |
Wed 30 April 2025 |
179.74 (-1.61%) |
183.00 |
167.00 - 203.60 |
0.4957 times |
Fri 28 March 2025 |
182.69 (9.05%) |
169.00 |
160.00 - 219.99 |
3.2528 times |
Fri 28 February 2025 |
167.53 (-21.21%) |
210.37 |
160.00 - 231.80 |
0.7291 times |
Fri 31 January 2025 |
212.64 (-7.98%) |
233.00 |
193.51 - 292.00 |
0.9041 times |
Tue 31 December 2024 |
231.08 (-3.96%) |
243.70 |
221.00 - 267.00 |
0.7372 times |
DMA SMA EMA moving averages of Hitech Corporation HITECHCORP
DMA (daily moving average) of Hitech Corporation HITECHCORP
| DMA period | DMA value | | 5 day DMA | 187.05 | | 12 day DMA | 187.27 | | 20 day DMA | 189.01 | | 35 day DMA | 194.45 | | 50 day DMA | 196.53 | | 100 day DMA | 195.99 | | 150 day DMA | 192.79 | | 200 day DMA | 195.09 | EMA (exponential moving average) of Hitech Corporation HITECHCORP
| EMA period | EMA current | EMA prev | EMA prev2 | | 5 day EMA | 186.78 | 187.13 | 187.88 | | 12 day EMA | 188.04 | 188.39 | 188.89 | | 20 day EMA | 189.68 | 190.06 | 190.53 | | 35 day EMA | 192.16 | 192.52 | 192.93 | | 50 day EMA | 195.18 | 195.55 | 195.95 |
SMA (simple moving average) of Hitech Corporation HITECHCORP
| SMA period | SMA current | SMA prev | SMA prev2 | | 5 day SMA | 187.05 | 187.98 | 187.72 | | 12 day SMA | 187.27 | 188.15 | 188.35 | | 20 day SMA | 189.01 | 189.17 | 189.44 | | 35 day SMA | 194.45 | 194.86 | 195.36 | | 50 day SMA | 196.53 | 196.87 | 197.2 | | 100 day SMA | 195.99 | 196.01 | 196.03 | | 150 day SMA | 192.79 | 192.9 | 193 | | 200 day SMA | 195.09 | 195.38 | 195.65 |
|
|
