HindustanOil HINDOILEXP full analysis,charts,indicators,moving averages,SMA,DMA,EMA,ADX,MACD,RSIHindustan Oil HINDOILEXP WideScreen charts, DMA,SMA,EMA technical analysis, forecast prediction, by indicators ADX,MACD,RSI,CCI NSE stock exchange
operates under Exploration & Production sector
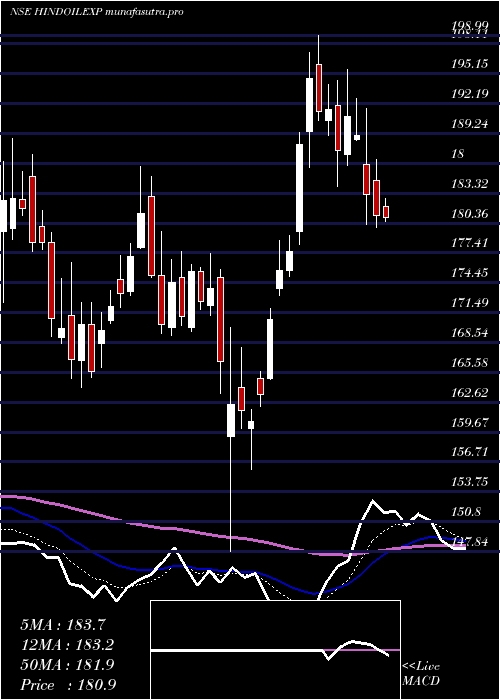
Daily price and charts and targets HindustanOil Strong Daily Stock price targets for HindustanOil HINDOILEXP are 147.66 and 154.2 | Daily Target 1 | 145.98 | | Daily Target 2 | 149.34 | | Daily Target 3 | 152.52 | | Daily Target 4 | 155.88 | | Daily Target 5 | 159.06 |
Daily price and volume Hindustan Oil
| Date |
Closing |
Open |
Range |
Volume |
Tue 28 October 2025 |
152.70 (-5.78%) |
155.00 |
149.16 - 155.70 |
4.3422 times |
Mon 27 October 2025 |
162.07 (-0.81%) |
163.90 |
161.20 - 164.53 |
0.4684 times |
Fri 24 October 2025 |
163.40 (-0.09%) |
165.00 |
162.85 - 166.00 |
0.8639 times |
Thu 23 October 2025 |
163.54 (1.32%) |
162.94 |
162.21 - 164.99 |
0.8483 times |
Tue 21 October 2025 |
161.41 (0.97%) |
160.99 |
160.82 - 162.00 |
0.0911 times |
Mon 20 October 2025 |
159.86 (-0.51%) |
160.75 |
159.50 - 161.10 |
0.3546 times |
Fri 17 October 2025 |
160.68 (-0.62%) |
161.43 |
159.51 - 161.95 |
0.5346 times |
Thu 16 October 2025 |
161.69 (0.17%) |
162.95 |
160.30 - 164.04 |
0.7483 times |
Wed 15 October 2025 |
161.42 (0.93%) |
160.57 |
159.70 - 162.40 |
0.6776 times |
Tue 14 October 2025 |
159.94 (-2.63%) |
164.70 |
159.50 - 164.70 |
1.0711 times |
Mon 13 October 2025 |
164.26 (-0.99%) |
164.01 |
159.92 - 164.79 |
1.5758 times |
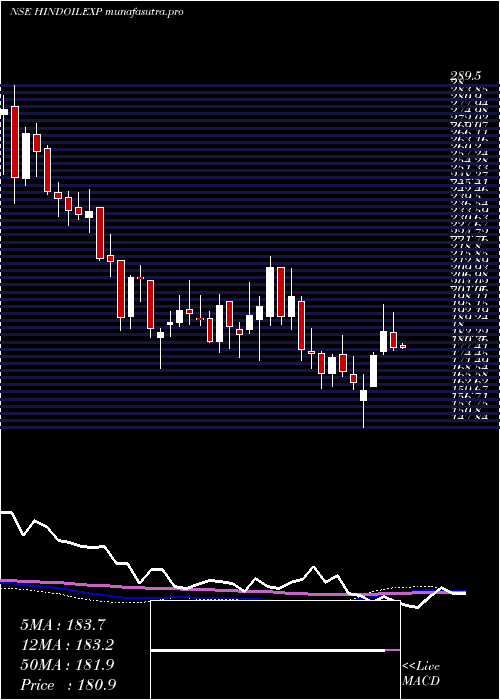
Weekly price and charts HindustanOil Strong weekly Stock price targets for HindustanOil HINDOILEXP are 143.25 and 158.62 | Weekly Target 1 | 140.09 | | Weekly Target 2 | 146.4 | | Weekly Target 3 | 155.46333333333 | | Weekly Target 4 | 161.77 | | Weekly Target 5 | 170.83 |
Weekly price and volumes for Hindustan Oil
| Date |
Closing |
Open |
Range |
Volume |
Tue 28 October 2025 |
152.70 (-6.55%) |
163.90 |
149.16 - 164.53 |
1.0595 times |
Fri 24 October 2025 |
163.40 (1.69%) |
160.75 |
159.50 - 166.00 |
0.4753 times |
Fri 17 October 2025 |
160.68 (-3.15%) |
164.01 |
159.50 - 164.79 |
1.0148 times |
Fri 10 October 2025 |
165.90 (-3.9%) |
172.64 |
163.20 - 173.50 |
0.7854 times |
Fri 03 October 2025 |
172.64 (-0.1%) |
173.99 |
169.25 - 174.80 |
0.5507 times |
Fri 26 September 2025 |
172.82 (-4.08%) |
179.80 |
172.05 - 182.00 |
1.0021 times |
Fri 19 September 2025 |
180.17 (6.85%) |
168.99 |
168.99 - 184.00 |
2.3452 times |
Fri 12 September 2025 |
168.62 (-3.61%) |
175.09 |
167.30 - 176.14 |
0.6718 times |
Fri 05 September 2025 |
174.93 (4.92%) |
166.73 |
166.02 - 177.80 |
1.5441 times |
Fri 29 August 2025 |
166.73 (-1.3%) |
168.99 |
160.40 - 171.90 |
0.551 times |
Fri 22 August 2025 |
168.93 (4.13%) |
164.90 |
160.78 - 172.82 |
1.1513 times |
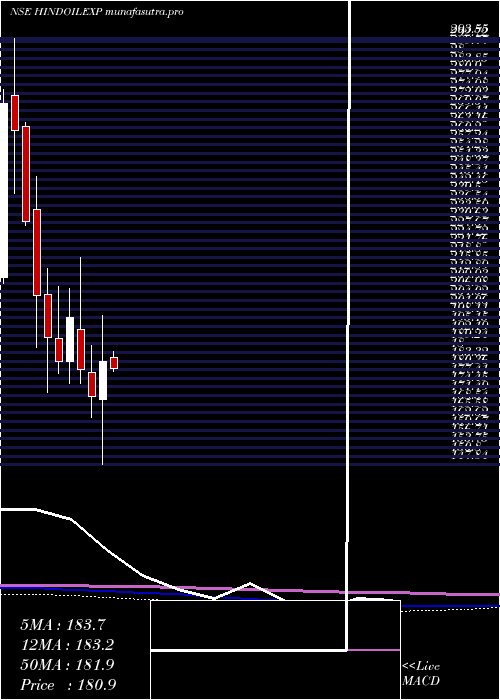
Monthly price and charts HindustanOil Strong monthly Stock price targets for HindustanOil HINDOILEXP are 138.27 and 163.6 | Monthly Target 1 | 133.45 | | Monthly Target 2 | 143.08 | | Monthly Target 3 | 158.78333333333 | | Monthly Target 4 | 168.41 | | Monthly Target 5 | 184.11 |
Monthly price and volumes Hindustan Oil
| Date |
Closing |
Open |
Range |
Volume |
Tue 28 October 2025 |
152.70 (-10.33%) |
170.50 |
149.16 - 174.49 |
0.484 times |
Tue 30 September 2025 |
170.30 (2.14%) |
166.73 |
166.02 - 184.00 |
0.789 times |
Fri 29 August 2025 |
166.73 (0.25%) |
166.00 |
157.00 - 172.82 |
0.3995 times |
Thu 31 July 2025 |
166.31 (-1.91%) |
170.39 |
161.47 - 176.00 |
0.7005 times |
Mon 30 June 2025 |
169.54 (-2.28%) |
173.99 |
165.00 - 186.90 |
1.7464 times |
Fri 30 May 2025 |
173.50 (-5.29%) |
184.61 |
169.00 - 194.35 |
0.8164 times |
Wed 30 April 2025 |
183.20 (7.1%) |
170.00 |
147.84 - 198.99 |
1.1274 times |
Fri 28 March 2025 |
171.06 (-5.13%) |
179.55 |
164.07 - 188.79 |
1.437 times |
Fri 28 February 2025 |
180.31 (-9.01%) |
193.99 |
175.50 - 218.80 |
1.3192 times |
Fri 31 January 2025 |
198.17 (8.2%) |
183.05 |
175.50 - 208.00 |
1.1806 times |
Tue 31 December 2024 |
183.16 (-4.28%) |
191.20 |
179.10 - 208.83 |
0.9202 times |
DMA SMA EMA moving averages of Hindustan Oil HINDOILEXP
DMA (daily moving average) of Hindustan Oil HINDOILEXP
| DMA period | DMA value | | 5 day DMA | 160.62 | | 12 day DMA | 161.41 | | 20 day DMA | 164.68 | | 35 day DMA | 168.73 | | 50 day DMA | 168.69 | | 100 day DMA | 168.4 | | 150 day DMA | 171.71 | | 200 day DMA | 176.32 | EMA (exponential moving average) of Hindustan Oil HINDOILEXP
| EMA period | EMA current | EMA prev | EMA prev2 | | 5 day EMA | 159.14 | 162.36 | 162.51 | | 12 day EMA | 161.76 | 163.41 | 163.65 | | 20 day EMA | 163.83 | 165 | 165.31 | | 35 day EMA | 165.33 | 166.07 | 166.31 | | 50 day EMA | 167.1 | 167.69 | 167.92 |
SMA (simple moving average) of Hindustan Oil HINDOILEXP
| SMA period | SMA current | SMA prev | SMA prev2 | | 5 day SMA | 160.62 | 162.06 | 161.78 | | 12 day SMA | 161.41 | 162.36 | 162.62 | | 20 day SMA | 164.68 | 165.69 | 166.38 | | 35 day SMA | 168.73 | 169.37 | 169.74 | | 50 day SMA | 168.69 | 168.82 | 168.81 | | 100 day SMA | 168.4 | 168.56 | 168.64 | | 150 day SMA | 171.71 | 171.84 | 171.9 | | 200 day SMA | 176.32 | 176.49 | 176.68 |
|
|
