HindconChemicals HINDCON full analysis,charts,indicators,moving averages,SMA,DMA,EMA,ADX,MACD,RSIHindcon Chemicals HINDCON WideScreen charts, DMA,SMA,EMA technical analysis, forecast prediction, by indicators ADX,MACD,RSI,CCI NSE stock exchange
Daily price and charts and targets HindconChemicals Strong Daily Stock price targets for HindconChemicals HINDCON are 31.86 and 32.91 | Daily Target 1 | 31.64 | | Daily Target 2 | 32.07 | | Daily Target 3 | 32.686666666667 | | Daily Target 4 | 33.12 | | Daily Target 5 | 33.74 |
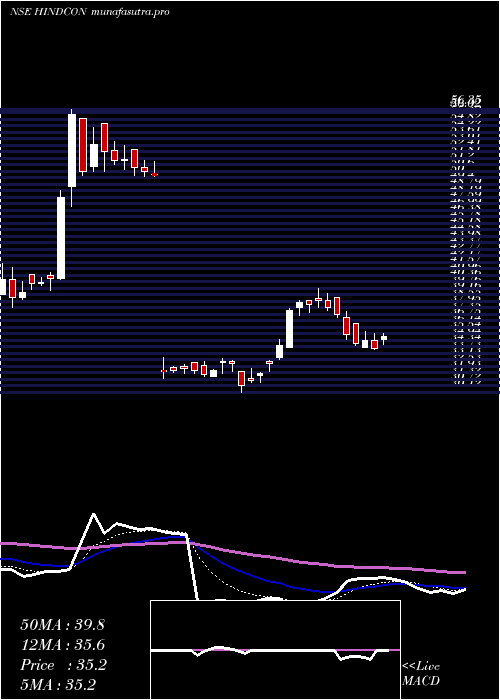
Daily price and volume Hindcon Chemicals
| Date |
Closing |
Open |
Range |
Volume |
Wed 29 October 2025 |
32.51 (-1.13%) |
33.30 |
32.25 - 33.30 |
0.4334 times |
Tue 28 October 2025 |
32.88 (0.55%) |
32.86 |
32.25 - 33.49 |
0.3574 times |
Mon 27 October 2025 |
32.70 (-1.74%) |
33.05 |
32.60 - 33.25 |
0.4378 times |
Fri 24 October 2025 |
33.28 (-0.48%) |
33.00 |
33.00 - 34.21 |
0.7951 times |
Thu 23 October 2025 |
33.44 (6.06%) |
31.59 |
30.75 - 37.75 |
6.626 times |
Tue 21 October 2025 |
31.53 (2.44%) |
31.00 |
30.52 - 31.88 |
0.1307 times |
Mon 20 October 2025 |
30.78 (0.03%) |
30.77 |
29.15 - 31.22 |
0.3135 times |
Fri 17 October 2025 |
30.77 (-1.38%) |
31.30 |
30.21 - 31.59 |
0.3064 times |
Thu 16 October 2025 |
31.20 (0.71%) |
31.25 |
30.29 - 31.50 |
0.2391 times |
Wed 15 October 2025 |
30.98 (1.97%) |
30.21 |
30.00 - 31.39 |
0.3607 times |
Tue 14 October 2025 |
30.38 (-2.16%) |
31.49 |
30.20 - 31.49 |
0.4427 times |
Weekly price and charts HindconChemicals Strong weekly Stock price targets for HindconChemicals HINDCON are 31.76 and 33 | Weekly Target 1 | 31.51 | | Weekly Target 2 | 32.01 | | Weekly Target 3 | 32.75 | | Weekly Target 4 | 33.25 | | Weekly Target 5 | 33.99 |
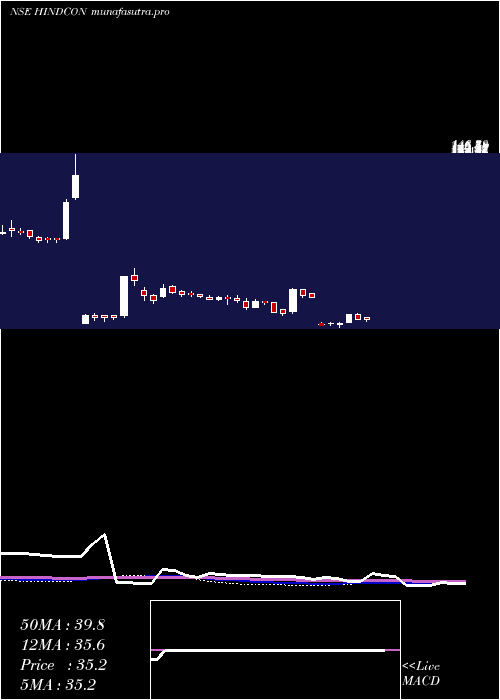
Weekly price and volumes for Hindcon Chemicals
| Date |
Closing |
Open |
Range |
Volume |
Wed 29 October 2025 |
32.51 (-2.31%) |
33.05 |
32.25 - 33.49 |
0.5228 times |
Fri 24 October 2025 |
33.28 (8.16%) |
30.77 |
29.15 - 37.75 |
3.347 times |
Fri 17 October 2025 |
30.77 (-1.72%) |
31.31 |
30.00 - 31.59 |
0.7258 times |
Fri 10 October 2025 |
31.31 (-3.96%) |
32.60 |
31.11 - 32.79 |
0.5193 times |
Fri 03 October 2025 |
32.60 (2.87%) |
31.50 |
31.01 - 32.80 |
0.5063 times |
Fri 26 September 2025 |
31.69 (-2.04%) |
32.35 |
31.50 - 33.21 |
0.7488 times |
Fri 19 September 2025 |
32.35 (1.38%) |
31.55 |
31.55 - 32.99 |
1.1705 times |
Fri 12 September 2025 |
31.91 (-2.71%) |
33.44 |
31.50 - 34.54 |
1.2145 times |
Fri 05 September 2025 |
32.80 (2.79%) |
32.20 |
31.52 - 33.79 |
0.8058 times |
Fri 29 August 2025 |
31.91 (-1.24%) |
32.95 |
31.50 - 33.08 |
0.4392 times |
Fri 22 August 2025 |
32.31 (-3.75%) |
33.60 |
31.05 - 34.95 |
0.8535 times |
Monthly price and charts HindconChemicals Strong monthly Stock price targets for HindconChemicals HINDCON are 30.83 and 39.43 | Monthly Target 1 | 24.54 | | Monthly Target 2 | 28.52 | | Monthly Target 3 | 33.136666666667 | | Monthly Target 4 | 37.12 | | Monthly Target 5 | 41.74 |
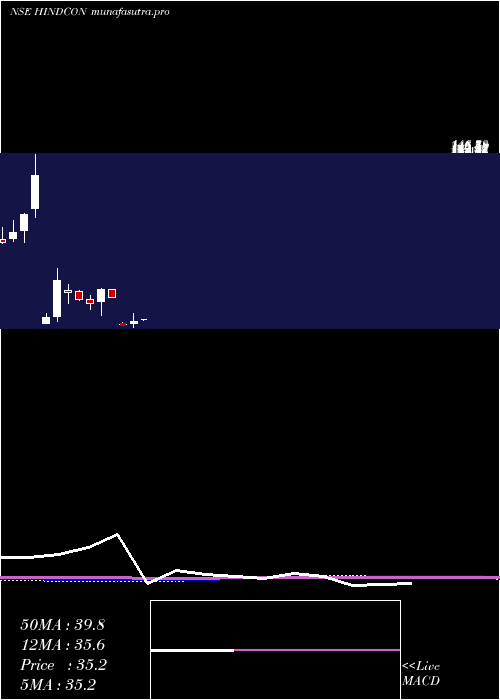
Monthly price and volumes Hindcon Chemicals
| Date |
Closing |
Open |
Range |
Volume |
Wed 29 October 2025 |
32.51 (3.63%) |
31.50 |
29.15 - 37.75 |
0.5486 times |
Tue 30 September 2025 |
31.37 (-1.69%) |
32.20 |
31.05 - 34.54 |
0.4383 times |
Fri 29 August 2025 |
31.91 (-5.79%) |
33.87 |
31.05 - 34.99 |
0.2994 times |
Thu 31 July 2025 |
33.87 (-4.56%) |
35.90 |
33.00 - 37.73 |
0.5987 times |
Mon 30 June 2025 |
35.49 (-3.61%) |
37.00 |
33.97 - 40.24 |
0.9533 times |
Fri 30 May 2025 |
36.82 (7.91%) |
34.99 |
32.40 - 39.70 |
0.6806 times |
Wed 30 April 2025 |
34.12 (6.29%) |
32.60 |
30.12 - 39.69 |
0.7088 times |
Fri 28 March 2025 |
32.10 (-36.14%) |
32.16 |
31.40 - 33.32 |
0.3209 times |
Wed 11 December 2024 |
50.27 (-9.96%) |
55.50 |
50.10 - 55.50 |
1.3566 times |
Fri 29 November 2024 |
55.83 (21.19%) |
47.10 |
38.00 - 56.35 |
4.0947 times |
Thu 31 October 2024 |
46.07 (-6.02%) |
49.02 |
42.03 - 51.60 |
1.5093 times |
DMA SMA EMA moving averages of Hindcon Chemicals HINDCON
DMA (daily moving average) of Hindcon Chemicals HINDCON
| DMA period | DMA value | | 5 day DMA | 32.96 | | 12 day DMA | 31.79 | | 20 day DMA | 31.79 | | 35 day DMA | 31.97 | | 50 day DMA | 32.23 | | 100 day DMA | 33.63 | | 150 day DMA | 34.26 | | 200 day DMA | 37.41 | EMA (exponential moving average) of Hindcon Chemicals HINDCON
| EMA period | EMA current | EMA prev | EMA prev2 | | 5 day EMA | 32.58 | 32.61 | 32.47 | | 12 day EMA | 32.19 | 32.13 | 31.99 | | 20 day EMA | 32.05 | 32 | 31.91 | | 35 day EMA | 32.09 | 32.07 | 32.02 | | 50 day EMA | 32.32 | 32.31 | 32.29 |
SMA (simple moving average) of Hindcon Chemicals HINDCON
| SMA period | SMA current | SMA prev | SMA prev2 | | 5 day SMA | 32.96 | 32.77 | 32.35 | | 12 day SMA | 31.79 | 31.69 | 31.58 | | 20 day SMA | 31.79 | 31.75 | 31.69 | | 35 day SMA | 31.97 | 31.96 | 31.96 | | 50 day SMA | 32.23 | 32.25 | 32.23 | | 100 day SMA | 33.63 | 33.65 | 33.67 | | 150 day SMA | 34.26 | 34.39 | 34.51 | | 200 day SMA | 37.41 | 37.5 | 37.59 |
|
|
