HG HGINFRA full analysis,charts,indicators,moving averages,SMA,DMA,EMA,ADX,MACD,RSIH G HGINFRA WideScreen charts, DMA,SMA,EMA technical analysis, forecast prediction, by indicators ADX,MACD,RSI,CCI NSE stock exchange
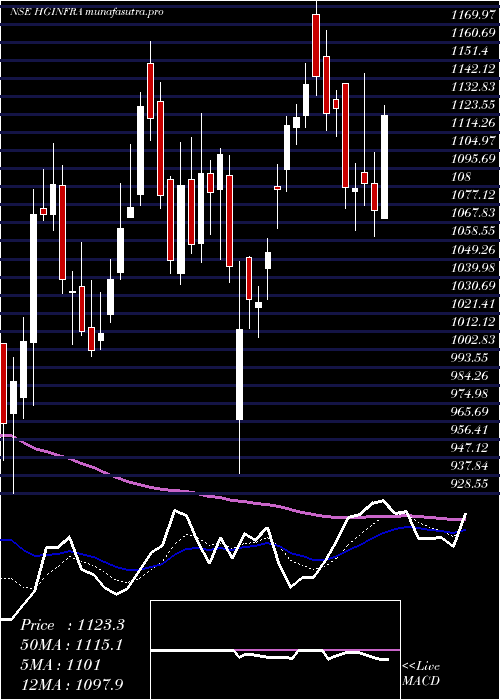
Daily price and charts and targets HG Strong Daily Stock price targets for HG HGINFRA are 919.5 and 938.35 | Daily Target 1 | 904.22 | | Daily Target 2 | 915.93 | | Daily Target 3 | 923.06666666667 | | Daily Target 4 | 934.78 | | Daily Target 5 | 941.92 |
Daily price and volume H G
| Date |
Closing |
Open |
Range |
Volume |
Wed 29 October 2025 |
927.65 (1.68%) |
912.25 |
911.35 - 930.20 |
1.0421 times |
Tue 28 October 2025 |
912.30 (-0.17%) |
916.00 |
909.60 - 921.00 |
0.708 times |
Mon 27 October 2025 |
913.85 (-0.11%) |
925.00 |
912.10 - 928.00 |
0.8459 times |
Fri 24 October 2025 |
914.85 (-2.37%) |
937.10 |
913.80 - 937.10 |
1.9339 times |
Thu 23 October 2025 |
937.10 (0.36%) |
933.75 |
933.75 - 943.00 |
0.747 times |
Tue 21 October 2025 |
933.75 (2.45%) |
937.00 |
925.15 - 939.80 |
0.9121 times |
Mon 20 October 2025 |
911.40 (-0.87%) |
928.50 |
908.35 - 928.50 |
1.3911 times |
Fri 17 October 2025 |
919.40 (-1.21%) |
940.00 |
918.00 - 941.00 |
0.8234 times |
Thu 16 October 2025 |
930.70 (1.31%) |
925.00 |
921.50 - 938.15 |
0.7595 times |
Wed 15 October 2025 |
918.65 (-0.37%) |
920.10 |
916.55 - 930.70 |
0.837 times |
Tue 14 October 2025 |
922.05 (-1.56%) |
936.00 |
920.65 - 939.85 |
0.7579 times |
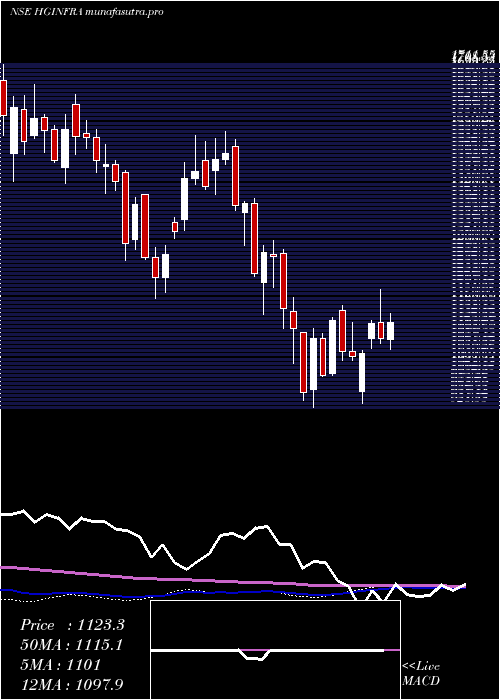
Weekly price and charts HG Strong weekly Stock price targets for HG HGINFRA are 918.63 and 939.23 | Weekly Target 1 | 901.88 | | Weekly Target 2 | 914.77 | | Weekly Target 3 | 922.48333333333 | | Weekly Target 4 | 935.37 | | Weekly Target 5 | 943.08 |
Weekly price and volumes for H G
| Date |
Closing |
Open |
Range |
Volume |
Wed 29 October 2025 |
927.65 (1.4%) |
925.00 |
909.60 - 930.20 |
0.3884 times |
Fri 24 October 2025 |
914.85 (-0.49%) |
928.50 |
908.35 - 943.00 |
0.7456 times |
Fri 17 October 2025 |
919.40 (-1.62%) |
937.95 |
916.55 - 941.35 |
0.5878 times |
Fri 10 October 2025 |
934.50 (-2.17%) |
954.00 |
918.00 - 954.00 |
1.1772 times |
Fri 03 October 2025 |
955.25 (1.58%) |
940.05 |
923.05 - 976.45 |
0.9652 times |
Fri 26 September 2025 |
940.40 (-6.41%) |
1004.75 |
935.60 - 1014.00 |
1.2666 times |
Fri 19 September 2025 |
1004.80 (3.24%) |
973.50 |
970.20 - 1049.95 |
2.2351 times |
Fri 12 September 2025 |
973.30 (-2.52%) |
1003.75 |
969.35 - 1012.90 |
1.0682 times |
Fri 05 September 2025 |
998.50 (2.8%) |
971.30 |
964.50 - 1009.70 |
0.8938 times |
Fri 29 August 2025 |
971.30 (-2.85%) |
1009.50 |
960.10 - 1011.80 |
0.672 times |
Fri 22 August 2025 |
999.80 (3.82%) |
967.90 |
961.20 - 1037.70 |
1.2304 times |
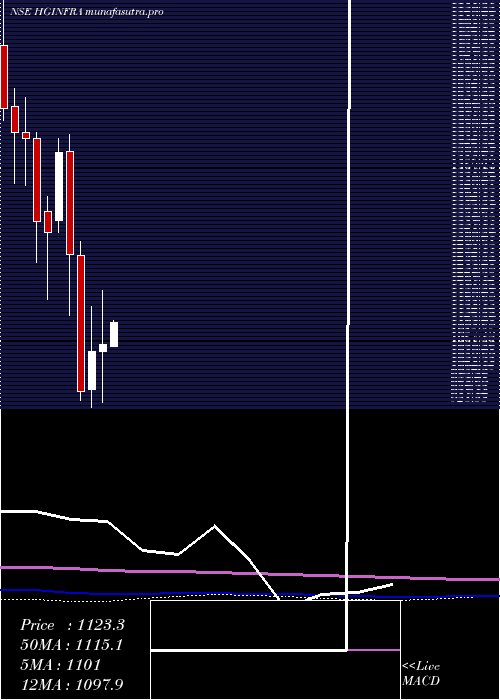
Monthly price and charts HG Strong monthly Stock price targets for HG HGINFRA are 883.95 and 952.05 | Monthly Target 1 | 869.38 | | Monthly Target 2 | 898.52 | | Monthly Target 3 | 937.48333333333 | | Monthly Target 4 | 966.62 | | Monthly Target 5 | 1005.58 |
Monthly price and volumes H G
| Date |
Closing |
Open |
Range |
Volume |
Wed 29 October 2025 |
927.65 (-0.23%) |
929.05 |
908.35 - 976.45 |
0.6668 times |
Tue 30 September 2025 |
929.80 (-4.27%) |
971.30 |
925.95 - 1049.95 |
1.1497 times |
Fri 29 August 2025 |
971.30 (-6.47%) |
1035.10 |
957.50 - 1043.90 |
0.7311 times |
Thu 31 July 2025 |
1038.50 (-3.66%) |
1084.10 |
1035.50 - 1143.00 |
1.1897 times |
Mon 30 June 2025 |
1078.00 (-3.73%) |
1120.50 |
994.80 - 1143.40 |
1.5447 times |
Fri 30 May 2025 |
1119.80 (4.26%) |
1070.00 |
1041.00 - 1275.00 |
1.1562 times |
Wed 30 April 2025 |
1074.00 (1.63%) |
1057.20 |
938.70 - 1198.00 |
0.7678 times |
Fri 28 March 2025 |
1056.80 (9.58%) |
969.50 |
928.55 - 1161.35 |
1.0552 times |
Fri 28 February 2025 |
964.40 (-24.77%) |
1279.15 |
945.45 - 1310.85 |
0.9827 times |
Fri 31 January 2025 |
1281.90 (-15.51%) |
1520.00 |
1141.45 - 1559.00 |
0.756 times |
Tue 31 December 2024 |
1517.25 (13.98%) |
1359.00 |
1333.05 - 1550.00 |
1.7471 times |
DMA SMA EMA moving averages of H G HGINFRA
DMA (daily moving average) of H G HGINFRA
| DMA period | DMA value | | 5 day DMA | 921.15 | | 12 day DMA | 923.2 | | 20 day DMA | 928.65 | | 35 day DMA | 953.82 | | 50 day DMA | 964.8 | | 100 day DMA | 1008.26 | | 150 day DMA | 1042.42 | | 200 day DMA | 1076.52 | EMA (exponential moving average) of H G HGINFRA
| EMA period | EMA current | EMA prev | EMA prev2 | | 5 day EMA | 921.2 | 917.97 | 920.8 | | 12 day EMA | 925.09 | 924.63 | 926.87 | | 20 day EMA | 932.72 | 933.25 | 935.45 | | 35 day EMA | 946.18 | 947.27 | 949.33 | | 50 day EMA | 962.28 | 963.69 | 965.79 |
SMA (simple moving average) of H G HGINFRA
| SMA period | SMA current | SMA prev | SMA prev2 | | 5 day SMA | 921.15 | 922.37 | 922.19 | | 12 day SMA | 923.2 | 923.77 | 924.86 | | 20 day SMA | 928.65 | 929.13 | 930.54 | | 35 day SMA | 953.82 | 955.71 | 958.17 | | 50 day SMA | 964.8 | 965.5 | 967.16 | | 100 day SMA | 1008.26 | 1009.48 | 1010.96 | | 150 day SMA | 1042.42 | 1043.4 | 1044.42 | | 200 day SMA | 1076.52 | 1079.21 | 1081.73 |
|
|
