HerculesHoists HERCULES full analysis,charts,indicators,moving averages,SMA,DMA,EMA,ADX,MACD,RSIHercules Hoists HERCULES WideScreen charts, DMA,SMA,EMA technical analysis, forecast prediction, by indicators ADX,MACD,RSI,CCI NSE stock exchange
operates under Industrial Machinery sector
Daily price and charts and targets HerculesHoists Strong Daily Stock price targets for HerculesHoists HERCULES are 185.14 and 188.09 | Daily Target 1 | 182.81 | | Daily Target 2 | 184.51 | | Daily Target 3 | 185.75666666667 | | Daily Target 4 | 187.46 | | Daily Target 5 | 188.71 |
Daily price and volume Hercules Hoists
| Date |
Closing |
Open |
Range |
Volume |
Tue 28 October 2025 |
186.22 (1.17%) |
184.07 |
184.05 - 187.00 |
0.4573 times |
Mon 27 October 2025 |
184.07 (-2.07%) |
189.85 |
183.10 - 192.98 |
0.8552 times |
Fri 24 October 2025 |
187.96 (-3.62%) |
195.01 |
187.00 - 195.01 |
0.8008 times |
Thu 23 October 2025 |
195.01 (-1.63%) |
198.64 |
193.01 - 201.89 |
0.7751 times |
Tue 21 October 2025 |
198.24 (0.68%) |
200.00 |
195.05 - 202.00 |
0.9111 times |
Mon 20 October 2025 |
196.90 (4.52%) |
187.51 |
187.51 - 198.90 |
1.3532 times |
Fri 17 October 2025 |
188.39 (-1.86%) |
192.55 |
187.22 - 194.90 |
0.6357 times |
Thu 16 October 2025 |
191.97 (0.85%) |
190.79 |
190.79 - 198.79 |
1.0517 times |
Wed 15 October 2025 |
190.35 (-3.08%) |
195.70 |
189.00 - 195.70 |
0.7708 times |
Tue 14 October 2025 |
196.39 (-0.33%) |
198.10 |
192.85 - 209.95 |
2.389 times |
Mon 13 October 2025 |
197.05 (-3.38%) |
204.00 |
196.10 - 204.00 |
1.5361 times |
Weekly price and charts HerculesHoists Strong weekly Stock price targets for HerculesHoists HERCULES are 179.72 and 189.6 | Weekly Target 1 | 177.55 | | Weekly Target 2 | 181.89 | | Weekly Target 3 | 187.43333333333 | | Weekly Target 4 | 191.77 | | Weekly Target 5 | 197.31 |
Weekly price and volumes for Hercules Hoists
| Date |
Closing |
Open |
Range |
Volume |
Tue 28 October 2025 |
186.22 (-0.93%) |
189.85 |
183.10 - 192.98 |
0.1099 times |
Fri 24 October 2025 |
187.96 (-0.23%) |
187.51 |
187.00 - 202.00 |
0.3215 times |
Fri 17 October 2025 |
188.39 (-7.62%) |
204.00 |
187.22 - 209.95 |
0.5345 times |
Fri 10 October 2025 |
203.94 (18.43%) |
169.10 |
169.10 - 224.99 |
3.6129 times |
Fri 03 October 2025 |
172.20 (1.64%) |
174.44 |
165.00 - 176.84 |
0.192 times |
Fri 26 September 2025 |
169.42 (-10.18%) |
189.00 |
168.70 - 193.59 |
0.3206 times |
Fri 19 September 2025 |
188.62 (-4.46%) |
174.49 |
170.00 - 196.25 |
0.6592 times |
Thu 12 June 2025 |
197.42 (-1.02%) |
204.00 |
194.00 - 238.75 |
2.0805 times |
Fri 06 June 2025 |
199.45 (20.71%) |
168.00 |
160.53 - 204.93 |
1.9141 times |
Fri 30 May 2025 |
165.23 (-1.01%) |
167.75 |
161.64 - 173.90 |
0.2549 times |
Fri 23 May 2025 |
166.92 (1.86%) |
164.69 |
160.02 - 171.00 |
0.3572 times |

Monthly price and charts HerculesHoists Strong monthly Stock price targets for HerculesHoists HERCULES are 175.61 and 235.6 | Monthly Target 1 | 132.08 | | Monthly Target 2 | 159.15 | | Monthly Target 3 | 192.07 | | Monthly Target 4 | 219.14 | | Monthly Target 5 | 252.06 |
Monthly price and volumes Hercules Hoists
| Date |
Closing |
Open |
Range |
Volume |
Tue 28 October 2025 |
186.22 (9.94%) |
171.95 |
165.00 - 224.99 |
1.0233 times |
Tue 30 September 2025 |
169.39 (-14.2%) |
174.49 |
168.70 - 196.25 |
0.2278 times |
Thu 12 June 2025 |
197.42 (19.48%) |
168.00 |
160.53 - 238.75 |
0.8691 times |
Fri 30 May 2025 |
165.23 (9.19%) |
151.64 |
146.22 - 173.90 |
0.2596 times |
Wed 30 April 2025 |
151.33 (4.73%) |
143.95 |
142.01 - 177.60 |
0.3872 times |
Fri 28 March 2025 |
144.50 (-9.64%) |
159.97 |
125.51 - 171.89 |
0.4709 times |
Fri 28 February 2025 |
159.91 (-37.02%) |
178.00 |
157.51 - 178.00 |
0.0486 times |
Tue 19 November 2024 |
253.92 (30.25%) |
196.50 |
193.00 - 311.00 |
3.2236 times |
Thu 31 October 2024 |
194.95 (-62.2%) |
539.90 |
182.15 - 710.00 |
3.0802 times |
Mon 30 September 2024 |
515.70 (-10.88%) |
584.85 |
502.55 - 626.95 |
0.4099 times |
Fri 30 August 2024 |
578.65 (-7.67%) |
626.70 |
557.40 - 648.00 |
0.5136 times |

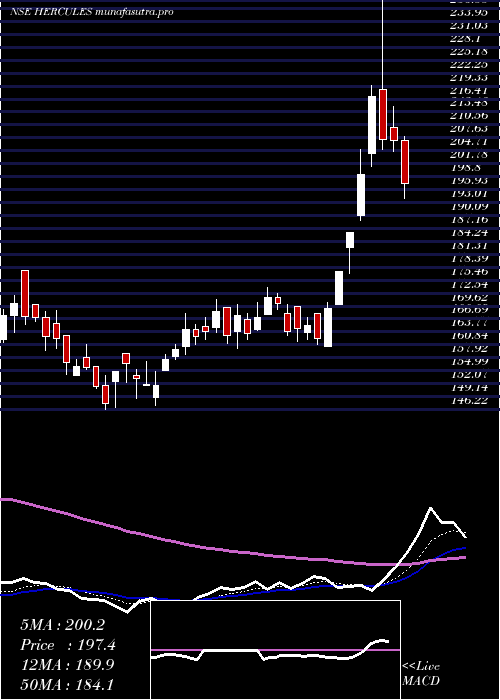
DMA SMA EMA moving averages of Hercules Hoists HERCULES
DMA (daily moving average) of Hercules Hoists HERCULES
| DMA period | DMA value | | 5 day DMA | 190.3 | | 12 day DMA | 193.04 | | 20 day DMA | 188.23 | | 35 day DMA | 188.43 | | 50 day DMA | 182.37 | | 100 day DMA | 168.87 | | 150 day DMA | 259.64 | | 200 day DMA | 344.34 | EMA (exponential moving average) of Hercules Hoists HERCULES
| EMA period | EMA current | EMA prev | EMA prev2 | | 5 day EMA | 188.63 | 189.84 | 192.73 | | 12 day EMA | 190.12 | 190.83 | 192.06 | | 20 day EMA | 188.95 | 189.24 | 189.78 | | 35 day EMA | 185.25 | 185.19 | 185.26 | | 50 day EMA | 181.2 | 181 | 180.87 |
SMA (simple moving average) of Hercules Hoists HERCULES
| SMA period | SMA current | SMA prev | SMA prev2 | | 5 day SMA | 190.3 | 192.44 | 193.3 | | 12 day SMA | 193.04 | 195.19 | 197.24 | | 20 day SMA | 188.23 | 187.39 | 187.08 | | 35 day SMA | 188.43 | 188.43 | 188.24 | | 50 day SMA | 182.37 | 181.9 | 181.5 | | 100 day SMA | 168.87 | 168.72 | 168.54 | | 150 day SMA | 259.64 | 262.38 | 265.15 | | 200 day SMA | 344.34 | 346.02 | 347.67 |
|
|
