HeidelbergcementIndia HEIDELBERG full analysis,charts,indicators,moving averages,SMA,DMA,EMA,ADX,MACD,RSIHeidelbergcement India HEIDELBERG WideScreen charts, DMA,SMA,EMA technical analysis, forecast prediction, by indicators ADX,MACD,RSI,CCI NSE stock exchange
operates under Cement & Cement Products sector
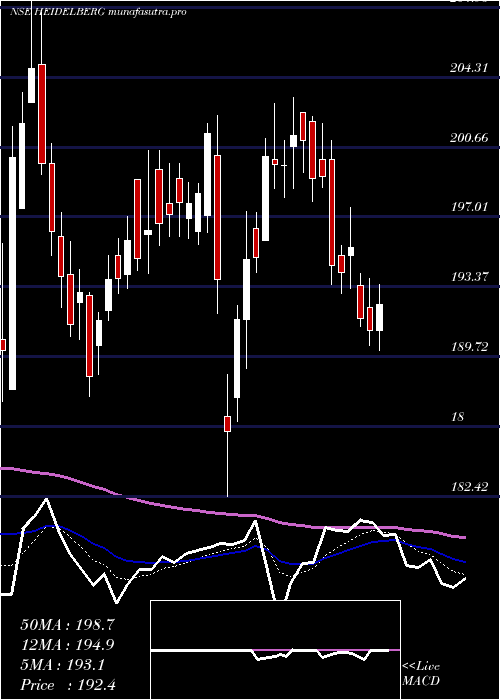
Daily price and charts and targets HeidelbergcementIndia Strong Daily Stock price targets for HeidelbergcementIndia HEIDELBERG are 193.78 and 194.72 | Daily Target 1 | 193.54 | | Daily Target 2 | 194.02 | | Daily Target 3 | 194.48 | | Daily Target 4 | 194.96 | | Daily Target 5 | 195.42 |
Daily price and volume Heidelbergcement India
| Date |
Closing |
Open |
Range |
Volume |
Tue 28 October 2025 |
194.50 (0.07%) |
194.90 |
194.00 - 194.94 |
0.3446 times |
Mon 27 October 2025 |
194.37 (0%) |
195.00 |
193.62 - 195.00 |
0.4071 times |
Fri 24 October 2025 |
194.37 (-0.19%) |
195.40 |
193.10 - 195.40 |
1.116 times |
Thu 23 October 2025 |
194.74 (-0.81%) |
196.00 |
194.05 - 196.91 |
1.4628 times |
Tue 21 October 2025 |
196.34 (1.52%) |
194.10 |
194.10 - 197.45 |
0.1569 times |
Mon 20 October 2025 |
193.40 (-0.02%) |
192.51 |
191.68 - 193.73 |
0.3178 times |
Fri 17 October 2025 |
193.43 (-1.38%) |
196.80 |
192.56 - 197.57 |
0.7914 times |
Thu 16 October 2025 |
196.14 (1.22%) |
194.11 |
194.11 - 197.79 |
0.4648 times |
Wed 15 October 2025 |
193.77 (-1.42%) |
195.20 |
191.80 - 196.40 |
4.0735 times |
Tue 14 October 2025 |
196.56 (-1.06%) |
198.10 |
194.75 - 199.70 |
0.8651 times |
Mon 13 October 2025 |
198.67 (-0.57%) |
199.45 |
198.15 - 201.97 |
0.355 times |
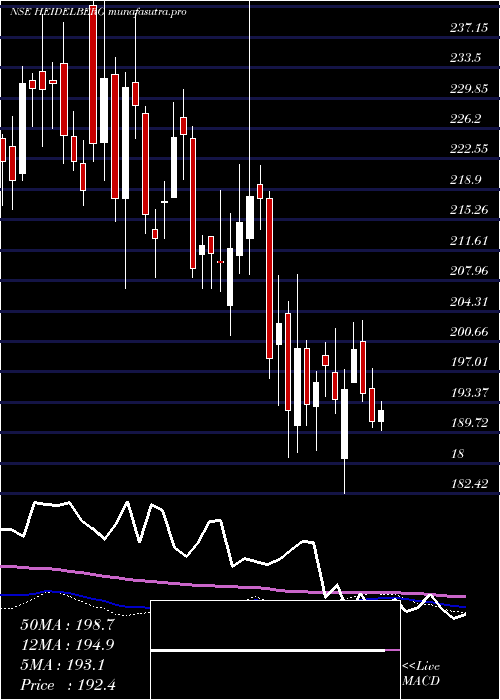
Weekly price and charts HeidelbergcementIndia Strong weekly Stock price targets for HeidelbergcementIndia HEIDELBERG are 193.37 and 194.75 | Weekly Target 1 | 192.99 | | Weekly Target 2 | 193.75 | | Weekly Target 3 | 194.37333333333 | | Weekly Target 4 | 195.13 | | Weekly Target 5 | 195.75 |
Weekly price and volumes for Heidelbergcement India
| Date |
Closing |
Open |
Range |
Volume |
Tue 28 October 2025 |
194.50 (0.07%) |
195.00 |
193.62 - 195.00 |
0.1747 times |
Fri 24 October 2025 |
194.37 (0.49%) |
192.51 |
191.68 - 197.45 |
0.7096 times |
Fri 17 October 2025 |
193.43 (-3.19%) |
199.45 |
191.80 - 201.97 |
1.522 times |
Fri 10 October 2025 |
199.81 (-0.56%) |
201.00 |
198.80 - 203.95 |
0.3893 times |
Fri 03 October 2025 |
200.93 (-1.63%) |
205.00 |
196.60 - 208.00 |
1.3446 times |
Fri 26 September 2025 |
204.25 (-4.24%) |
213.15 |
202.21 - 216.99 |
1.0956 times |
Fri 19 September 2025 |
213.29 (0.46%) |
211.25 |
208.34 - 214.95 |
0.907 times |
Fri 12 September 2025 |
212.31 (-0.97%) |
215.79 |
210.01 - 220.90 |
2.4314 times |
Fri 05 September 2025 |
214.38 (4.31%) |
205.64 |
205.64 - 218.73 |
0.8048 times |
Fri 29 August 2025 |
205.53 (-4.04%) |
215.00 |
204.06 - 215.00 |
0.6211 times |
Fri 22 August 2025 |
214.19 (0.19%) |
217.80 |
213.50 - 224.80 |
2.119 times |
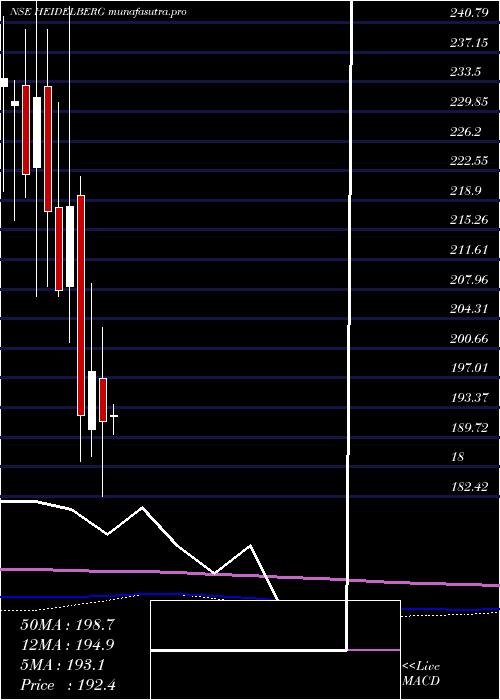
Monthly price and charts HeidelbergcementIndia Strong monthly Stock price targets for HeidelbergcementIndia HEIDELBERG are 186.78 and 199.4 | Monthly Target 1 | 184.21 | | Monthly Target 2 | 189.35 | | Monthly Target 3 | 196.82666666667 | | Monthly Target 4 | 201.97 | | Monthly Target 5 | 209.45 |
Monthly price and volumes Heidelbergcement India
| Date |
Closing |
Open |
Range |
Volume |
Tue 28 October 2025 |
194.50 (-3.13%) |
200.80 |
191.68 - 204.30 |
0.458 times |
Tue 30 September 2025 |
200.79 (-2.31%) |
205.64 |
196.60 - 220.90 |
0.9534 times |
Fri 29 August 2025 |
205.53 (-3.46%) |
212.00 |
204.06 - 224.80 |
0.8304 times |
Thu 31 July 2025 |
212.90 (3.54%) |
205.90 |
203.50 - 221.70 |
1.5978 times |
Mon 30 June 2025 |
205.62 (4.12%) |
197.49 |
191.29 - 209.10 |
0.6717 times |
Fri 30 May 2025 |
197.49 (3.03%) |
192.30 |
185.08 - 204.41 |
1.1106 times |
Wed 30 April 2025 |
191.69 (-3.08%) |
196.92 |
182.42 - 203.24 |
0.4752 times |
Fri 28 March 2025 |
197.79 (2.79%) |
190.63 |
187.35 - 208.69 |
0.7441 times |
Fri 28 February 2025 |
192.42 (-11.77%) |
219.50 |
186.74 - 221.81 |
0.4752 times |
Fri 31 January 2025 |
218.08 (4.94%) |
208.25 |
201.40 - 242.78 |
2.6836 times |
Tue 31 December 2024 |
207.81 (-4.46%) |
217.99 |
207.01 - 230.94 |
0.7003 times |
DMA SMA EMA moving averages of Heidelbergcement India HEIDELBERG
DMA (daily moving average) of Heidelbergcement India HEIDELBERG
| DMA period | DMA value | | 5 day DMA | 194.86 | | 12 day DMA | 195.51 | | 20 day DMA | 197.76 | | 35 day DMA | 203.88 | | 50 day DMA | 206.62 | | 100 day DMA | 207.01 | | 150 day DMA | 203.39 | | 200 day DMA | 204.27 | EMA (exponential moving average) of Heidelbergcement India HEIDELBERG
| EMA period | EMA current | EMA prev | EMA prev2 | | 5 day EMA | 194.65 | 194.73 | 194.91 | | 12 day EMA | 196.09 | 196.38 | 196.75 | | 20 day EMA | 198.31 | 198.71 | 199.17 | | 35 day EMA | 201.84 | 202.27 | 202.73 | | 50 day EMA | 205.9 | 206.36 | 206.85 |
SMA (simple moving average) of Heidelbergcement India HEIDELBERG
| SMA period | SMA current | SMA prev | SMA prev2 | | 5 day SMA | 194.86 | 194.64 | 194.46 | | 12 day SMA | 195.51 | 196.03 | 196.5 | | 20 day SMA | 197.76 | 198.25 | 198.94 | | 35 day SMA | 203.88 | 204.45 | 205.03 | | 50 day SMA | 206.62 | 207.03 | 207.39 | | 100 day SMA | 207.01 | 207 | 207 | | 150 day SMA | 203.39 | 203.38 | 203.36 | | 200 day SMA | 204.27 | 204.35 | 204.43 |
|
|
