BirlaslamcHealthy HEALTHY full analysis,charts,indicators,moving averages,SMA,DMA,EMA,ADX,MACD,RSIBirlaslamc Healthy HEALTHY WideScreen charts, DMA,SMA,EMA technical analysis, forecast prediction, by indicators ADX,MACD,RSI,CCI NSE stock exchange
Daily price and charts and targets BirlaslamcHealthy Strong Daily Stock price targets for BirlaslamcHealthy HEALTHY are 15.11 and 15.35 | Daily Target 1 | 15.04 | | Daily Target 2 | 15.18 | | Daily Target 3 | 15.283333333333 | | Daily Target 4 | 15.42 | | Daily Target 5 | 15.52 |
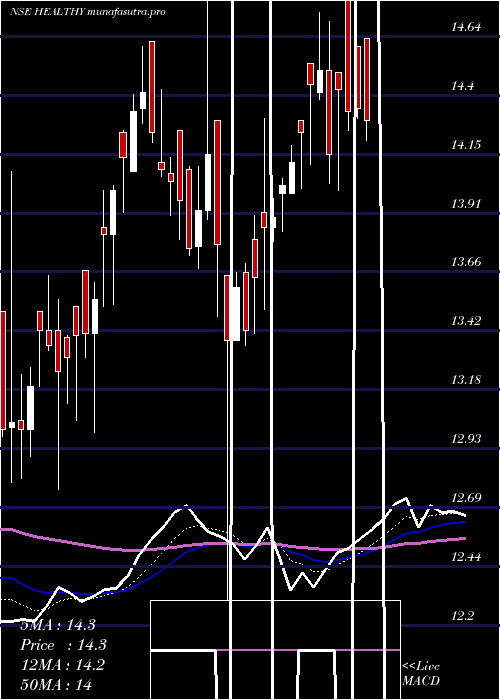
Daily price and volume Birlaslamc Healthy
| Date |
Closing |
Open |
Range |
Volume |
Wed 29 October 2025 |
15.31 (0.33%) |
15.34 |
15.15 - 15.39 |
0.5805 times |
Tue 28 October 2025 |
15.26 (-0.07%) |
15.29 |
15.13 - 15.30 |
0.5022 times |
Mon 27 October 2025 |
15.27 (0.07%) |
15.34 |
15.13 - 15.34 |
0.8116 times |
Fri 24 October 2025 |
15.26 (-0.46%) |
15.13 |
15.13 - 15.43 |
0.3827 times |
Thu 23 October 2025 |
15.33 (-0.33%) |
15.38 |
15.00 - 15.49 |
1.3218 times |
Tue 21 October 2025 |
15.38 (-0.13%) |
15.55 |
14.86 - 15.55 |
0.4015 times |
Mon 20 October 2025 |
15.40 (0.98%) |
15.32 |
15.25 - 15.49 |
4.3128 times |
Fri 17 October 2025 |
15.25 (0.93%) |
15.18 |
15.02 - 15.31 |
0.9441 times |
Thu 16 October 2025 |
15.11 (0.13%) |
15.16 |
15.02 - 15.24 |
0.4008 times |
Wed 15 October 2025 |
15.09 (0.47%) |
15.05 |
15.02 - 15.15 |
0.342 times |
Tue 14 October 2025 |
15.02 (-0.53%) |
14.72 |
14.72 - 15.38 |
1.023 times |
Weekly price and charts BirlaslamcHealthy Strong weekly Stock price targets for BirlaslamcHealthy HEALTHY are 15.09 and 15.35 | Weekly Target 1 | 15.02 | | Weekly Target 2 | 15.16 | | Weekly Target 3 | 15.276666666667 | | Weekly Target 4 | 15.42 | | Weekly Target 5 | 15.54 |
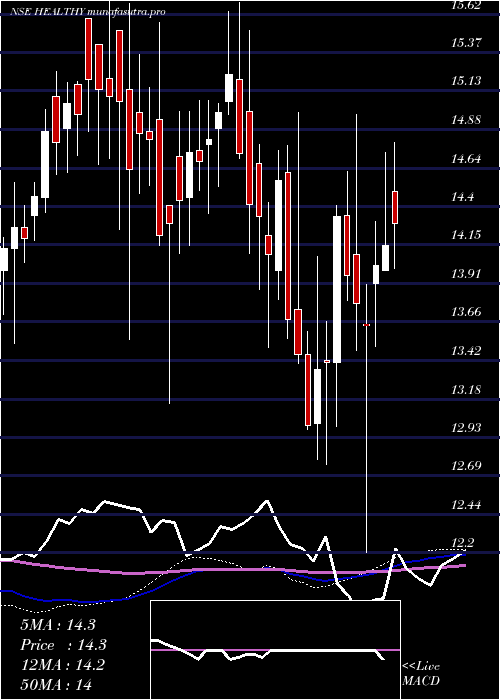
Weekly price and volumes for Birlaslamc Healthy
| Date |
Closing |
Open |
Range |
Volume |
Wed 29 October 2025 |
15.31 (0.33%) |
15.34 |
15.13 - 15.39 |
0.5829 times |
Fri 24 October 2025 |
15.26 (0.07%) |
15.32 |
14.86 - 15.55 |
1.9752 times |
Fri 17 October 2025 |
15.25 (0.86%) |
15.39 |
14.72 - 15.39 |
1.0257 times |
Fri 10 October 2025 |
15.12 (3%) |
14.74 |
14.31 - 15.35 |
1.0085 times |
Fri 03 October 2025 |
14.68 (0.82%) |
14.56 |
14.19 - 15.40 |
0.6634 times |
Fri 26 September 2025 |
14.56 (-4.46%) |
15.02 |
14.45 - 15.47 |
1.0374 times |
Fri 19 September 2025 |
15.24 (0.86%) |
14.73 |
14.68 - 15.40 |
1.101 times |
Fri 12 September 2025 |
15.11 (1.68%) |
15.23 |
14.46 - 15.40 |
0.7907 times |
Fri 05 September 2025 |
14.86 (1.09%) |
14.61 |
14.38 - 15.11 |
1.0367 times |
Fri 29 August 2025 |
14.70 (-2.71%) |
15.48 |
14.65 - 16.01 |
0.7784 times |
Fri 22 August 2025 |
15.11 (0.67%) |
15.38 |
14.64 - 15.38 |
0.6394 times |
Monthly price and charts BirlaslamcHealthy Strong monthly Stock price targets for BirlaslamcHealthy HEALTHY are 14.75 and 16.11 | Monthly Target 1 | 13.66 | | Monthly Target 2 | 14.48 | | Monthly Target 3 | 15.016666666667 | | Monthly Target 4 | 15.84 | | Monthly Target 5 | 16.38 |
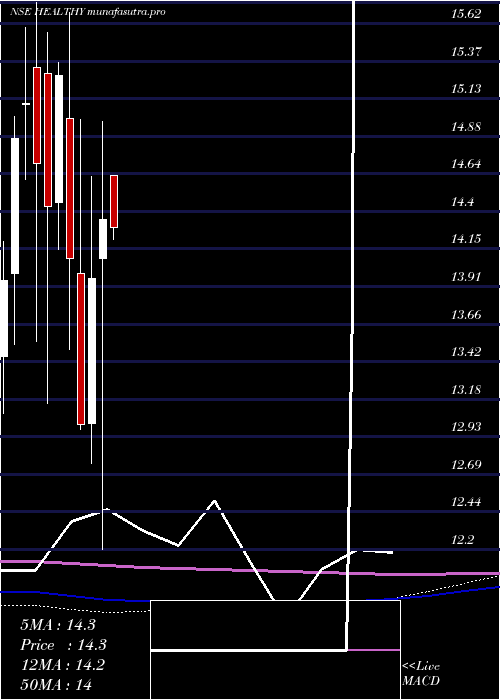
Monthly price and volumes Birlaslamc Healthy
| Date |
Closing |
Open |
Range |
Volume |
Wed 29 October 2025 |
15.31 (5.22%) |
14.19 |
14.19 - 15.55 |
0.8423 times |
Tue 30 September 2025 |
14.55 (-1.02%) |
14.61 |
14.19 - 15.47 |
0.731 times |
Fri 29 August 2025 |
14.70 (-3.67%) |
15.40 |
14.36 - 16.01 |
0.6968 times |
Thu 31 July 2025 |
15.26 (3.32%) |
14.40 |
14.40 - 16.25 |
1.018 times |
Mon 30 June 2025 |
14.77 (3.87%) |
14.28 |
13.82 - 15.11 |
0.89 times |
Fri 30 May 2025 |
14.22 (-0.84%) |
14.63 |
13.17 - 14.82 |
1.0237 times |
Wed 30 April 2025 |
14.34 (2.72%) |
14.09 |
12.20 - 14.98 |
0.8628 times |
Fri 28 March 2025 |
13.96 (7.3%) |
13.02 |
12.76 - 14.62 |
1.54 times |
Fri 28 February 2025 |
13.01 (-7.67%) |
13.99 |
12.98 - 14.99 |
0.9299 times |
Fri 31 January 2025 |
14.09 (-7.79%) |
15.00 |
13.50 - 15.69 |
1.4655 times |
Tue 31 December 2024 |
15.28 (5.89%) |
14.45 |
14.15 - 15.36 |
1.2041 times |
DMA SMA EMA moving averages of Birlaslamc Healthy HEALTHY
DMA (daily moving average) of Birlaslamc Healthy HEALTHY
| DMA period | DMA value | | 5 day DMA | 15.29 | | 12 day DMA | 15.23 | | 20 day DMA | 15.07 | | 35 day DMA | 15.04 | | 50 day DMA | 15 | | 100 day DMA | 14.91 | | 150 day DMA | 14.66 | | 200 day DMA | 14.48 | EMA (exponential moving average) of Birlaslamc Healthy HEALTHY
| EMA period | EMA current | EMA prev | EMA prev2 | | 5 day EMA | 15.28 | 15.27 | 15.28 | | 12 day EMA | 15.22 | 15.2 | 15.19 | | 20 day EMA | 15.16 | 15.14 | 15.13 | | 35 day EMA | 15.08 | 15.07 | 15.06 | | 50 day EMA | 15.01 | 15 | 14.99 |
SMA (simple moving average) of Birlaslamc Healthy HEALTHY
| SMA period | SMA current | SMA prev | SMA prev2 | | 5 day SMA | 15.29 | 15.3 | 15.33 | | 12 day SMA | 15.23 | 15.22 | 15.19 | | 20 day SMA | 15.07 | 15.04 | 15 | | 35 day SMA | 15.04 | 15.02 | 15.01 | | 50 day SMA | 15 | 14.99 | 14.99 | | 100 day SMA | 14.91 | 14.9 | 14.89 | | 150 day SMA | 14.66 | 14.65 | 14.64 | | 200 day SMA | 14.48 | 14.48 | 14.48 |
|
|
