HousingDev HDIL_BZ full analysis,charts,indicators,moving averages,SMA,DMA,EMA,ADX,MACD,RSIHousing Dev HDIL_BZ WideScreen charts, DMA,SMA,EMA technical analysis, forecast prediction, by indicators ADX,MACD,RSI,CCI NSE stock exchange
Daily price and charts and targets HousingDev Strong Daily Stock price targets for HousingDev HDIL_BZ are 2.79 and 2.9 | Daily Target 1 | 2.76 | | Daily Target 2 | 2.81 | | Daily Target 3 | 2.8666666666667 | | Daily Target 4 | 2.92 | | Daily Target 5 | 2.98 |
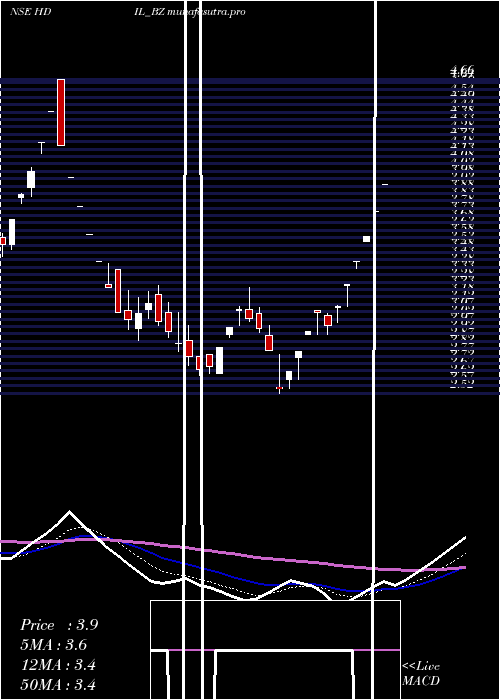
Daily price and volume Housing Dev
| Date |
Closing |
Open |
Range |
Volume |
Tue 28 October 2025 |
2.87 (-0.69%) |
2.89 |
2.81 - 2.92 |
0.6576 times |
Mon 27 October 2025 |
2.89 (2.12%) |
2.83 |
2.79 - 2.93 |
0.8941 times |
Fri 24 October 2025 |
2.83 (-1.74%) |
2.87 |
2.80 - 2.99 |
1.1916 times |
Thu 23 October 2025 |
2.88 (1.77%) |
2.80 |
2.70 - 2.97 |
2.5967 times |
Tue 21 October 2025 |
2.83 (1.07%) |
2.80 |
2.75 - 2.87 |
0.4332 times |
Mon 20 October 2025 |
2.80 (-0.36%) |
2.84 |
2.76 - 2.90 |
0.8814 times |
Fri 17 October 2025 |
2.81 (-4.42%) |
2.98 |
2.80 - 2.98 |
1.7368 times |
Thu 16 October 2025 |
2.94 (1.38%) |
2.90 |
2.88 - 3.00 |
0.459 times |
Wed 15 October 2025 |
2.90 (0.35%) |
2.89 |
2.86 - 2.95 |
0.366 times |
Tue 14 October 2025 |
2.89 (-0.34%) |
2.90 |
2.86 - 2.95 |
0.7835 times |
Mon 13 October 2025 |
2.90 (-0.34%) |
2.91 |
2.88 - 3.00 |
0.7226 times |
Weekly price and charts HousingDev Strong weekly Stock price targets for HousingDev HDIL_BZ are 2.83 and 2.97 | Weekly Target 1 | 2.72 | | Weekly Target 2 | 2.8 | | Weekly Target 3 | 2.8633333333333 | | Weekly Target 4 | 2.94 | | Weekly Target 5 | 3 |
Weekly price and volumes for Housing Dev
| Date |
Closing |
Open |
Range |
Volume |
Tue 28 October 2025 |
2.87 (1.41%) |
2.83 |
2.79 - 2.93 |
0.4429 times |
Fri 24 October 2025 |
2.83 (0.71%) |
2.84 |
2.70 - 2.99 |
1.4566 times |
Fri 17 October 2025 |
2.81 (-3.44%) |
2.91 |
2.80 - 3.00 |
1.1611 times |
Fri 10 October 2025 |
2.91 (-3.32%) |
2.96 |
2.86 - 3.03 |
1.1312 times |
Fri 03 October 2025 |
3.01 (1.35%) |
2.91 |
2.90 - 3.05 |
0.6686 times |
Fri 26 September 2025 |
2.97 (-3.26%) |
3.12 |
2.88 - 3.20 |
1.1384 times |
Fri 19 September 2025 |
3.07 (0.99%) |
2.98 |
2.98 - 3.25 |
1.3619 times |
Fri 12 September 2025 |
3.04 (-1.62%) |
3.22 |
2.93 - 3.27 |
1.3178 times |
Fri 05 September 2025 |
3.09 (1.98%) |
3.03 |
2.96 - 3.21 |
0.7548 times |
Fri 29 August 2025 |
3.03 (-4.42%) |
3.15 |
2.98 - 3.24 |
0.5667 times |
Fri 22 August 2025 |
3.17 (0.96%) |
3.14 |
2.98 - 3.36 |
1.4256 times |

Monthly price and charts HousingDev Strong monthly Stock price targets for HousingDev HDIL_BZ are 2.61 and 2.96 | Monthly Target 1 | 2.52 | | Monthly Target 2 | 2.7 | | Monthly Target 3 | 2.8733333333333 | | Monthly Target 4 | 3.05 | | Monthly Target 5 | 3.22 |
Monthly price and volumes Housing Dev
| Date |
Closing |
Open |
Range |
Volume |
Tue 28 October 2025 |
2.87 (-2.71%) |
2.95 |
2.70 - 3.05 |
0.8729 times |
Tue 30 September 2025 |
2.95 (-2.64%) |
3.03 |
2.88 - 3.27 |
0.9508 times |
Fri 29 August 2025 |
3.03 (10.18%) |
2.88 |
2.80 - 3.36 |
1.3235 times |
Mon 28 July 2025 |
2.75 (-17.66%) |
3.17 |
2.75 - 3.33 |
0.3155 times |
Mon 30 June 2025 |
3.34 (9.87%) |
3.19 |
3.19 - 4.04 |
0.8536 times |
Mon 26 May 2025 |
3.04 (-18.72%) |
3.55 |
3.04 - 3.55 |
0.1463 times |
Mon 28 April 2025 |
3.74 (46.67%) |
2.61 |
2.55 - 3.94 |
0.8836 times |
Fri 28 March 2025 |
2.55 (-25.44%) |
3.26 |
2.52 - 3.40 |
2.9318 times |
Mon 24 February 2025 |
3.42 (-18.76%) |
3.99 |
3.42 - 3.99 |
0.1452 times |
Mon 27 January 2025 |
4.21 (11.67%) |
3.86 |
3.31 - 4.66 |
1.5767 times |
Tue 31 December 2024 |
3.77 (-7.37%) |
4.10 |
3.65 - 4.25 |
1.3252 times |

DMA SMA EMA moving averages of Housing Dev HDIL_BZ
DMA (daily moving average) of Housing Dev HDIL_BZ
| DMA period | DMA value | | 5 day DMA | 2.86 | | 12 day DMA | 2.87 | | 20 day DMA | 2.89 | | 35 day DMA | 2.96 | | 50 day DMA | 3 | | 100 day DMA | 3.09 | | 150 day DMA | 3.32 | | 200 day DMA | 3.54 | EMA (exponential moving average) of Housing Dev HDIL_BZ
| EMA period | EMA current | EMA prev | EMA prev2 | | 5 day EMA | 2.86 | 2.86 | 2.84 | | 12 day EMA | 2.86 | 2.86 | 2.86 | | 20 day EMA | 2.91 | 2.91 | 2.91 | | 35 day EMA | 2.95 | 2.95 | 2.95 | | 50 day EMA | 3 | 3.01 | 3.01 |
SMA (simple moving average) of Housing Dev HDIL_BZ
| SMA period | SMA current | SMA prev | SMA prev2 | | 5 day SMA | 2.86 | 2.85 | 2.83 | | 12 day SMA | 2.87 | 2.87 | 2.87 | | 20 day SMA | 2.89 | 2.9 | 2.9 | | 35 day SMA | 2.96 | 2.97 | 2.97 | | 50 day SMA | 3 | 3.01 | 3.02 | | 100 day SMA | 3.09 | 3.09 | 3.1 | | 150 day SMA | 3.32 | 3.33 | 3.33 | | 200 day SMA | 3.54 | 3.55 | 3.55 |
|
|
