HdfcamcHdfcvalue HDFCVALUE full analysis,charts,indicators,moving averages,SMA,DMA,EMA,ADX,MACD,RSIHdfcamc Hdfcvalue HDFCVALUE WideScreen charts, DMA,SMA,EMA technical analysis, forecast prediction, by indicators ADX,MACD,RSI,CCI NSE stock exchange
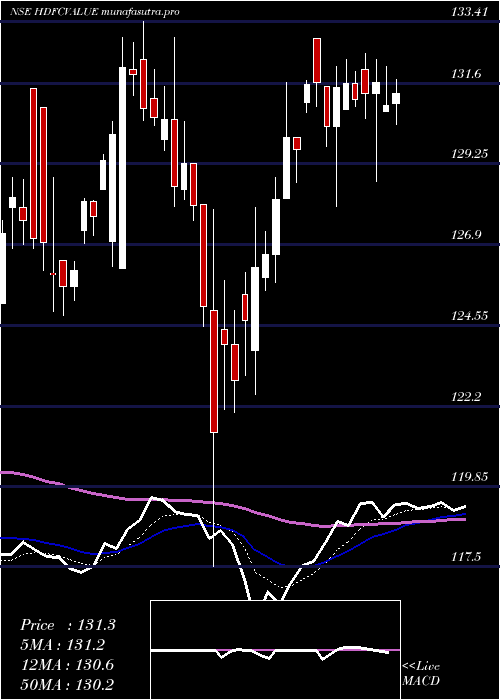
Daily price and charts and targets HdfcamcHdfcvalue Strong Daily Stock price targets for HdfcamcHdfcvalue HDFCVALUE are 137.1 and 139.7 | Daily Target 1 | 135 | | Daily Target 2 | 136.6 | | Daily Target 3 | 137.6 | | Daily Target 4 | 139.2 | | Daily Target 5 | 140.2 |
Daily price and volume Hdfcamc Hdfcvalue
| Date |
Closing |
Open |
Range |
Volume |
Wed 29 October 2025 |
138.20 (0.41%) |
136.45 |
136.00 - 138.60 |
1.3169 times |
Tue 28 October 2025 |
137.64 (-0.29%) |
136.60 |
136.52 - 138.29 |
0.378 times |
Mon 27 October 2025 |
138.04 (0.48%) |
138.06 |
137.43 - 138.60 |
0.4133 times |
Fri 24 October 2025 |
137.38 (-0.01%) |
136.23 |
136.03 - 137.88 |
1.8636 times |
Thu 23 October 2025 |
137.40 (0.53%) |
136.20 |
136.01 - 138.40 |
2.5321 times |
Tue 21 October 2025 |
136.68 (0.23%) |
136.00 |
136.00 - 137.00 |
0.2457 times |
Mon 20 October 2025 |
136.37 (0.71%) |
136.00 |
135.41 - 136.50 |
0.454 times |
Fri 17 October 2025 |
135.41 (0.03%) |
133.80 |
133.80 - 136.50 |
1.2705 times |
Thu 16 October 2025 |
135.37 (1.48%) |
133.40 |
133.40 - 136.00 |
0.7906 times |
Wed 15 October 2025 |
133.40 (-0.18%) |
132.87 |
132.87 - 136.24 |
0.7353 times |
Tue 14 October 2025 |
133.64 (-0.71%) |
134.60 |
132.50 - 134.60 |
1.8844 times |
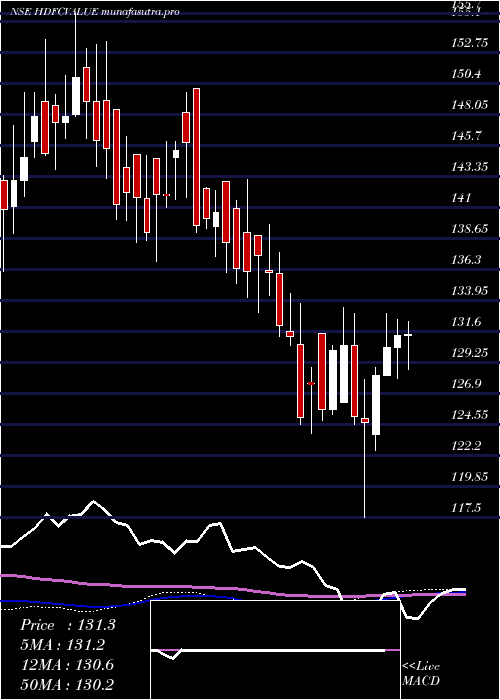
Weekly price and charts HdfcamcHdfcvalue Strong weekly Stock price targets for HdfcamcHdfcvalue HDFCVALUE are 137.1 and 139.7 | Weekly Target 1 | 135 | | Weekly Target 2 | 136.6 | | Weekly Target 3 | 137.6 | | Weekly Target 4 | 139.2 | | Weekly Target 5 | 140.2 |
Weekly price and volumes for Hdfcamc Hdfcvalue
| Date |
Closing |
Open |
Range |
Volume |
Wed 29 October 2025 |
138.20 (0.6%) |
138.06 |
136.00 - 138.60 |
0.8419 times |
Fri 24 October 2025 |
137.38 (1.45%) |
136.00 |
135.41 - 138.40 |
2.035 times |
Fri 17 October 2025 |
135.41 (0.42%) |
134.11 |
132.50 - 136.50 |
1.9746 times |
Fri 10 October 2025 |
134.84 (1.46%) |
133.56 |
132.65 - 136.75 |
0.6462 times |
Fri 03 October 2025 |
132.90 (1.1%) |
132.10 |
130.89 - 133.10 |
0.4274 times |
Fri 26 September 2025 |
131.45 (-3.01%) |
135.53 |
130.97 - 136.16 |
1.394 times |
Fri 19 September 2025 |
135.53 (0.62%) |
134.69 |
131.01 - 136.58 |
0.9485 times |
Fri 12 September 2025 |
134.69 (2.37%) |
132.04 |
131.67 - 134.91 |
0.6106 times |
Fri 05 September 2025 |
131.57 (0.23%) |
134.70 |
131.05 - 134.70 |
0.5655 times |
Fri 29 August 2025 |
131.27 (-0.46%) |
132.53 |
130.97 - 133.89 |
0.5562 times |
Fri 22 August 2025 |
131.88 (0.86%) |
131.99 |
131.36 - 134.19 |
0.614 times |
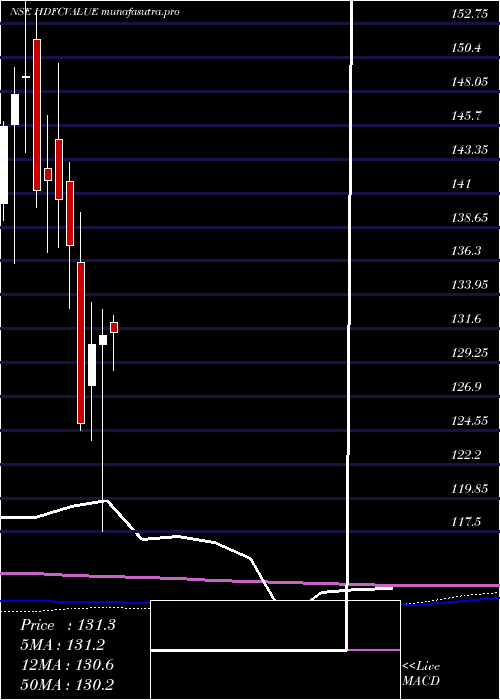
Monthly price and charts HdfcamcHdfcvalue Strong monthly Stock price targets for HdfcamcHdfcvalue HDFCVALUE are 134.68 and 142.12 | Monthly Target 1 | 128.55 | | Monthly Target 2 | 133.37 | | Monthly Target 3 | 135.98666666667 | | Monthly Target 4 | 140.81 | | Monthly Target 5 | 143.43 |
Monthly price and volumes Hdfcamc Hdfcvalue
| Date |
Closing |
Open |
Range |
Volume |
Wed 29 October 2025 |
138.20 (5.26%) |
131.55 |
131.16 - 138.60 |
0.7999 times |
Tue 30 September 2025 |
131.30 (0.02%) |
134.70 |
130.89 - 136.58 |
0.525 times |
Fri 29 August 2025 |
131.27 (0.05%) |
132.50 |
127.13 - 134.19 |
0.4711 times |
Thu 31 July 2025 |
131.21 (-3.3%) |
135.70 |
130.48 - 137.48 |
0.6574 times |
Mon 30 June 2025 |
135.69 (1.42%) |
136.31 |
130.38 - 137.85 |
0.6884 times |
Fri 30 May 2025 |
133.79 (2.04%) |
132.01 |
127.71 - 138.68 |
1.4259 times |
Wed 30 April 2025 |
131.12 (0.44%) |
130.54 |
117.50 - 132.94 |
1.4995 times |
Fri 28 March 2025 |
130.54 (4.4%) |
127.64 |
123.87 - 133.41 |
1.2136 times |
Fri 28 February 2025 |
125.04 (-8.98%) |
136.17 |
124.52 - 139.65 |
0.9164 times |
Fri 31 January 2025 |
137.37 (-2.26%) |
141.84 |
133.00 - 143.11 |
1.8028 times |
Tue 31 December 2024 |
140.55 (-0.94%) |
144.73 |
137.23 - 149.97 |
0.6366 times |
DMA SMA EMA moving averages of Hdfcamc Hdfcvalue HDFCVALUE
DMA (daily moving average) of Hdfcamc Hdfcvalue HDFCVALUE
| DMA period | DMA value | | 5 day DMA | 137.73 | | 12 day DMA | 136.18 | | 20 day DMA | 135.05 | | 35 day DMA | 134.57 | | 50 day DMA | 133.89 | | 100 day DMA | 133.65 | | 150 day DMA | 132.77 | | 200 day DMA | 132.71 | EMA (exponential moving average) of Hdfcamc Hdfcvalue HDFCVALUE
| EMA period | EMA current | EMA prev | EMA prev2 | | 5 day EMA | 137.59 | 137.29 | 137.11 | | 12 day EMA | 136.51 | 136.2 | 135.94 | | 20 day EMA | 135.69 | 135.43 | 135.2 | | 35 day EMA | 134.72 | 134.51 | 134.33 | | 50 day EMA | 133.95 | 133.78 | 133.62 |
SMA (simple moving average) of Hdfcamc Hdfcvalue HDFCVALUE
| SMA period | SMA current | SMA prev | SMA prev2 | | 5 day SMA | 137.73 | 137.43 | 137.17 | | 12 day SMA | 136.18 | 135.9 | 135.63 | | 20 day SMA | 135.05 | 134.72 | 134.41 | | 35 day SMA | 134.57 | 134.4 | 134.23 | | 50 day SMA | 133.89 | 133.74 | 133.61 | | 100 day SMA | 133.65 | 133.6 | 133.55 | | 150 day SMA | 132.77 | 132.71 | 132.64 | | 200 day SMA | 132.71 | 132.71 | 132.72 |
|
|
