HdfcamcHdfcsml250 HDFCSML250 full analysis,charts,indicators,moving averages,SMA,DMA,EMA,ADX,MACD,RSIHdfcamc Hdfcsml250 HDFCSML250 WideScreen charts, DMA,SMA,EMA technical analysis, forecast prediction, by indicators ADX,MACD,RSI,CCI NSE stock exchange
Daily price and charts and targets HdfcamcHdfcsml250 Strong Daily Stock price targets for HdfcamcHdfcsml250 HDFCSML250 are 173.49 and 174.87 | Daily Target 1 | 173.2 | | Daily Target 2 | 173.77 | | Daily Target 3 | 174.58 | | Daily Target 4 | 175.15 | | Daily Target 5 | 175.96 |
Daily price and volume Hdfcamc Hdfcsml250
| Date |
Closing |
Open |
Range |
Volume |
Tue 28 October 2025 |
174.34 (-0.19%) |
174.78 |
174.01 - 175.39 |
0.4196 times |
Mon 27 October 2025 |
174.68 (0.97%) |
178.19 |
173.01 - 178.19 |
0.7341 times |
Fri 24 October 2025 |
173.00 (-0.44%) |
169.41 |
169.41 - 174.38 |
2.0952 times |
Thu 23 October 2025 |
173.76 (0.05%) |
174.89 |
173.02 - 175.00 |
0.9263 times |
Tue 21 October 2025 |
173.67 (0.63%) |
176.90 |
172.02 - 176.90 |
0.4964 times |
Mon 20 October 2025 |
172.59 (0.62%) |
173.97 |
171.52 - 175.02 |
1.201 times |
Fri 17 October 2025 |
171.52 (-0.58%) |
172.52 |
171.15 - 172.90 |
1.2452 times |
Thu 16 October 2025 |
172.52 (0.4%) |
172.69 |
171.64 - 173.00 |
1.2789 times |
Wed 15 October 2025 |
171.83 (1.27%) |
170.81 |
170.05 - 172.00 |
0.5565 times |
Tue 14 October 2025 |
169.68 (-1.11%) |
174.00 |
168.05 - 174.00 |
1.0468 times |
Mon 13 October 2025 |
171.59 (-0.51%) |
172.32 |
170.69 - 172.32 |
1.36 times |
Weekly price and charts HdfcamcHdfcsml250 Strong weekly Stock price targets for HdfcamcHdfcsml250 HDFCSML250 are 171.09 and 176.27 | Weekly Target 1 | 170 | | Weekly Target 2 | 172.17 | | Weekly Target 3 | 175.18 | | Weekly Target 4 | 177.35 | | Weekly Target 5 | 180.36 |
Weekly price and volumes for Hdfcamc Hdfcsml250
| Date |
Closing |
Open |
Range |
Volume |
Tue 28 October 2025 |
174.34 (0.77%) |
178.19 |
173.01 - 178.19 |
0.2825 times |
Fri 24 October 2025 |
173.00 (0.86%) |
173.97 |
169.41 - 176.90 |
1.1554 times |
Fri 17 October 2025 |
171.52 (-0.55%) |
172.32 |
168.05 - 174.00 |
1.3436 times |
Fri 10 October 2025 |
172.47 (0.53%) |
171.02 |
169.80 - 173.40 |
0.8609 times |
Fri 03 October 2025 |
171.56 (1.88%) |
170.50 |
166.45 - 172.38 |
0.9277 times |
Fri 26 September 2025 |
168.39 (-4.34%) |
177.00 |
168.05 - 178.00 |
1.7232 times |
Fri 19 September 2025 |
176.03 (1.82%) |
173.49 |
172.00 - 177.49 |
1.3576 times |
Fri 12 September 2025 |
172.88 (1.73%) |
171.49 |
170.04 - 176.39 |
0.5487 times |
Fri 05 September 2025 |
169.94 (2.15%) |
166.30 |
166.22 - 173.35 |
0.9039 times |
Fri 29 August 2025 |
166.36 (-2.93%) |
172.28 |
164.55 - 176.94 |
0.8965 times |
Fri 22 August 2025 |
171.38 (1.98%) |
169.76 |
168.11 - 173.50 |
0.8964 times |
Monthly price and charts HdfcamcHdfcsml250 Strong monthly Stock price targets for HdfcamcHdfcsml250 HDFCSML250 are 170.4 and 182.14 | Monthly Target 1 | 161.25 | | Monthly Target 2 | 167.8 | | Monthly Target 3 | 172.99333333333 | | Monthly Target 4 | 179.54 | | Monthly Target 5 | 184.73 |
Monthly price and volumes Hdfcamc Hdfcsml250
| Date |
Closing |
Open |
Range |
Volume |
Tue 28 October 2025 |
174.34 (3.9%) |
166.45 |
166.45 - 178.19 |
1.0244 times |
Tue 30 September 2025 |
167.79 (0.86%) |
166.30 |
166.22 - 178.00 |
1.2008 times |
Fri 29 August 2025 |
166.36 (-3.45%) |
174.00 |
164.55 - 176.94 |
0.8079 times |
Thu 31 July 2025 |
172.30 (-3.76%) |
179.48 |
171.05 - 183.18 |
1.1314 times |
Mon 30 June 2025 |
179.04 (5.95%) |
170.66 |
165.98 - 180.45 |
1.0009 times |
Fri 30 May 2025 |
168.99 (9.47%) |
155.88 |
147.00 - 170.40 |
1.0482 times |
Wed 30 April 2025 |
154.37 (1.51%) |
151.97 |
136.27 - 161.63 |
1.0262 times |
Fri 28 March 2025 |
152.07 (8.97%) |
142.80 |
135.21 - 158.00 |
0.8743 times |
Fri 28 February 2025 |
139.55 (-12.72%) |
161.00 |
138.13 - 166.00 |
1.0332 times |
Fri 31 January 2025 |
159.89 (-10.51%) |
178.96 |
149.00 - 186.65 |
0.8527 times |
Tue 31 December 2024 |
178.66 (0.61%) |
181.00 |
175.20 - 186.88 |
0.4869 times |
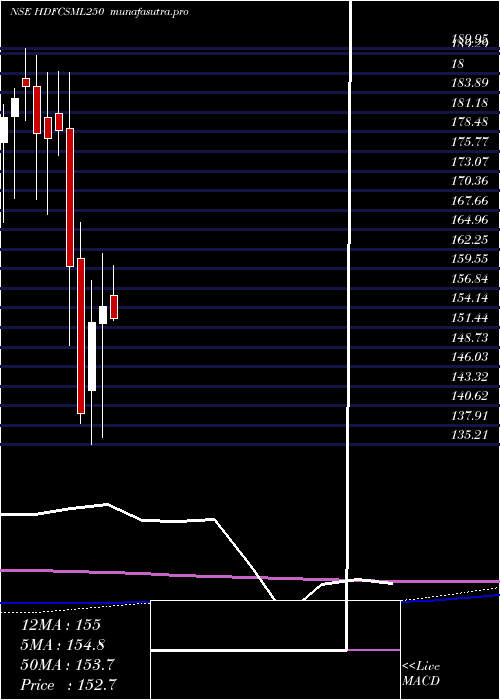
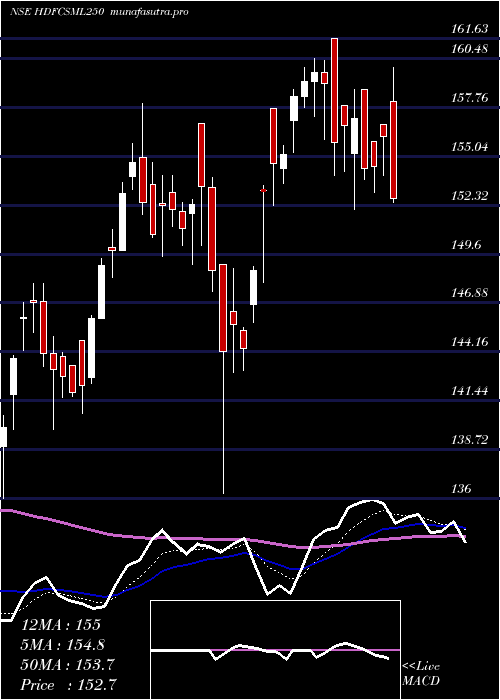
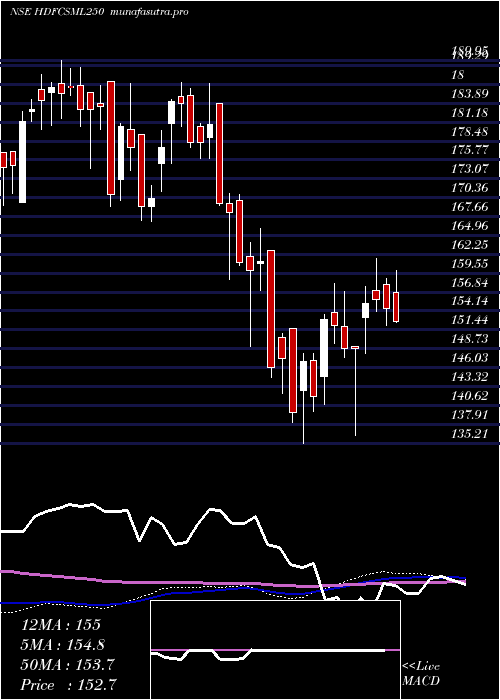
DMA SMA EMA moving averages of Hdfcamc Hdfcsml250 HDFCSML250
DMA (daily moving average) of Hdfcamc Hdfcsml250 HDFCSML250
| DMA period | DMA value | | 5 day DMA | 173.89 | | 12 day DMA | 172.64 | | 20 day DMA | 171.68 | | 35 day DMA | 172.31 | | 50 day DMA | 171.57 | | 100 day DMA | 173.22 | | 150 day DMA | 168.02 | | 200 day DMA | 164.63 | EMA (exponential moving average) of Hdfcamc Hdfcsml250 HDFCSML250
| EMA period | EMA current | EMA prev | EMA prev2 | | 5 day EMA | 173.8 | 173.53 | 172.95 | | 12 day EMA | 172.94 | 172.69 | 172.33 | | 20 day EMA | 172.47 | 172.27 | 172.02 | | 35 day EMA | 171.8 | 171.65 | 171.47 | | 50 day EMA | 171.51 | 171.39 | 171.26 |
SMA (simple moving average) of Hdfcamc Hdfcsml250 HDFCSML250
| SMA period | SMA current | SMA prev | SMA prev2 | | 5 day SMA | 173.89 | 173.54 | 172.91 | | 12 day SMA | 172.64 | 172.4 | 172.03 | | 20 day SMA | 171.68 | 171.38 | 171.25 | | 35 day SMA | 172.31 | 172.19 | 172.04 | | 50 day SMA | 171.57 | 171.46 | 171.31 | | 100 day SMA | 173.22 | 173.19 | 173.15 | | 150 day SMA | 168.02 | 167.85 | 167.66 | | 200 day SMA | 164.63 | 164.64 | 164.67 |
|
|
