HdfcamcHdfcpsubk HDFCPSUBK full analysis,charts,indicators,moving averages,SMA,DMA,EMA,ADX,MACD,RSIHdfcamc Hdfcpsubk HDFCPSUBK WideScreen charts, DMA,SMA,EMA technical analysis, forecast prediction, by indicators ADX,MACD,RSI,CCI NSE stock exchange
Daily price and charts and targets HdfcamcHdfcpsubk Strong Daily Stock price targets for HdfcamcHdfcpsubk HDFCPSUBK are 81.01 and 82.52 | Daily Target 1 | 79.82 | | Daily Target 2 | 80.68 | | Daily Target 3 | 81.326666666667 | | Daily Target 4 | 82.19 | | Daily Target 5 | 82.84 |
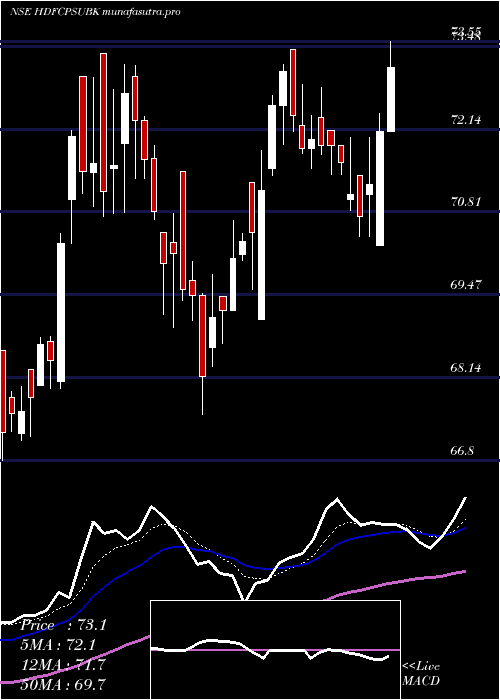
Daily price and volume Hdfcamc Hdfcpsubk
| Date |
Closing |
Open |
Range |
Volume |
Tue 28 October 2025 |
81.55 (0.82%) |
81.29 |
80.46 - 81.97 |
1.3567 times |
Mon 27 October 2025 |
80.89 (2.52%) |
78.30 |
78.30 - 81.81 |
1.555 times |
Fri 24 October 2025 |
78.90 (-0.69%) |
79.45 |
78.27 - 80.14 |
0.8083 times |
Thu 23 October 2025 |
79.45 (0.11%) |
79.36 |
78.96 - 80.21 |
1.3205 times |
Tue 21 October 2025 |
79.36 (0%) |
79.70 |
78.86 - 81.00 |
1.2357 times |
Mon 20 October 2025 |
79.36 (3.21%) |
77.41 |
77.41 - 79.73 |
1.4164 times |
Fri 17 October 2025 |
76.89 (-0.83%) |
77.36 |
76.55 - 77.70 |
0.4804 times |
Thu 16 October 2025 |
77.53 (-0.55%) |
77.96 |
77.31 - 79.36 |
0.8021 times |
Wed 15 October 2025 |
77.96 (1.7%) |
77.07 |
76.97 - 78.05 |
0.6784 times |
Tue 14 October 2025 |
76.66 (-1.38%) |
78.48 |
76.47 - 78.48 |
0.3466 times |
Mon 13 October 2025 |
77.73 (0.27%) |
79.45 |
76.93 - 79.45 |
1.2123 times |
Weekly price and charts HdfcamcHdfcpsubk Strong weekly Stock price targets for HdfcamcHdfcpsubk HDFCPSUBK are 79.93 and 83.6 | Weekly Target 1 | 76.94 | | Weekly Target 2 | 79.24 | | Weekly Target 3 | 80.606666666667 | | Weekly Target 4 | 82.91 | | Weekly Target 5 | 84.28 |
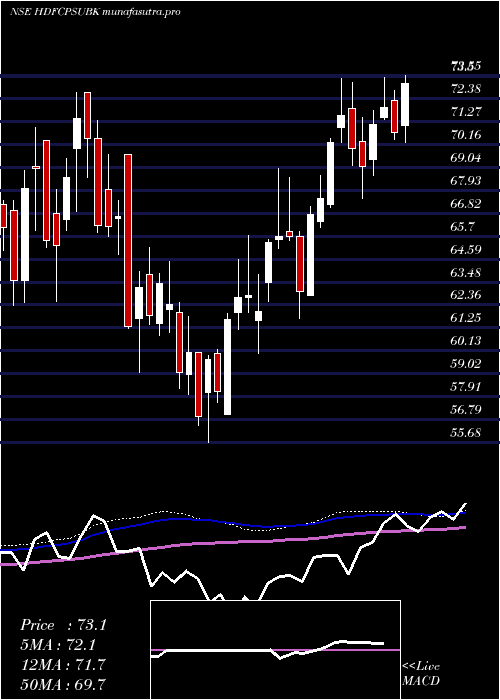
Weekly price and volumes for Hdfcamc Hdfcpsubk
| Date |
Closing |
Open |
Range |
Volume |
Tue 28 October 2025 |
81.55 (3.36%) |
78.30 |
78.30 - 81.97 |
0.5893 times |
Fri 24 October 2025 |
78.90 (2.61%) |
77.41 |
77.41 - 81.00 |
0.9677 times |
Fri 17 October 2025 |
76.89 (-0.81%) |
79.45 |
76.47 - 79.45 |
0.7124 times |
Fri 10 October 2025 |
77.52 (1.51%) |
76.37 |
75.42 - 77.86 |
0.8507 times |
Fri 03 October 2025 |
76.37 (4.4%) |
75.34 |
73.27 - 76.74 |
1.2464 times |
Fri 26 September 2025 |
73.15 (-1.8%) |
74.50 |
73.00 - 76.14 |
1.2101 times |
Fri 19 September 2025 |
74.49 (4.66%) |
71.49 |
71.13 - 74.74 |
3.3339 times |
Fri 12 September 2025 |
71.17 (2.77%) |
70.98 |
69.13 - 71.99 |
0.5138 times |
Fri 05 September 2025 |
69.25 (1.78%) |
68.38 |
68.38 - 69.99 |
0.2602 times |
Fri 29 August 2025 |
68.04 (-3.8%) |
70.73 |
67.98 - 71.04 |
0.3154 times |
Fri 22 August 2025 |
70.73 (-0.18%) |
70.88 |
70.03 - 72.46 |
0.5143 times |
Monthly price and charts HdfcamcHdfcpsubk Strong monthly Stock price targets for HdfcamcHdfcpsubk HDFCPSUBK are 78.31 and 85.21 | Monthly Target 1 | 72.63 | | Monthly Target 2 | 77.09 | | Monthly Target 3 | 79.53 | | Monthly Target 4 | 83.99 | | Monthly Target 5 | 86.43 |
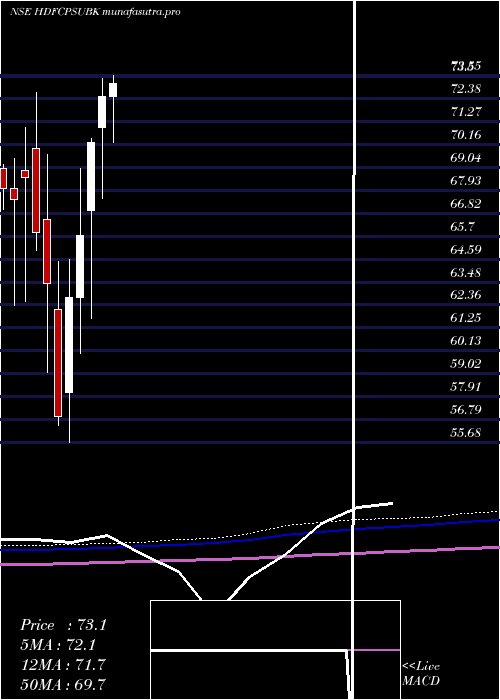
Monthly price and volumes Hdfcamc Hdfcpsubk
| Date |
Closing |
Open |
Range |
Volume |
Tue 28 October 2025 |
81.55 (7.66%) |
76.19 |
75.07 - 81.97 |
0.8924 times |
Tue 30 September 2025 |
75.75 (11.33%) |
68.38 |
68.38 - 76.14 |
1.5247 times |
Fri 29 August 2025 |
68.04 (-1.78%) |
69.61 |
67.98 - 72.46 |
0.3716 times |
Thu 31 July 2025 |
69.27 (-4.48%) |
72.52 |
68.26 - 73.55 |
1.7183 times |
Mon 30 June 2025 |
72.52 (3.17%) |
71.00 |
67.53 - 73.36 |
1.5041 times |
Fri 30 May 2025 |
70.29 (6.9%) |
66.96 |
61.70 - 70.45 |
0.9055 times |
Wed 30 April 2025 |
65.75 (4.83%) |
62.73 |
60.00 - 68.98 |
0.9599 times |
Fri 28 March 2025 |
62.72 (10.15%) |
58.08 |
55.68 - 64.58 |
0.6994 times |
Fri 28 February 2025 |
56.94 (-10.2%) |
62.12 |
56.49 - 64.47 |
0.5066 times |
Fri 31 January 2025 |
63.41 (-3.73%) |
66.50 |
59.10 - 69.68 |
0.9175 times |
Tue 31 December 2024 |
65.87 (-3.95%) |
70.00 |
65.00 - 72.70 |
1.4599 times |
DMA SMA EMA moving averages of Hdfcamc Hdfcpsubk HDFCPSUBK
DMA (daily moving average) of Hdfcamc Hdfcpsubk HDFCPSUBK
| DMA period | DMA value | | 5 day DMA | 80.03 | | 12 day DMA | 78.65 | | 20 day DMA | 77.58 | | 35 day DMA | 75.44 | | 50 day DMA | 73.8 | | 100 day DMA | 72.32 | | 150 day DMA | 70.02 | | 200 day DMA | 67.74 | EMA (exponential moving average) of Hdfcamc Hdfcpsubk HDFCPSUBK
| EMA period | EMA current | EMA prev | EMA prev2 | | 5 day EMA | 80.18 | 79.49 | 78.79 | | 12 day EMA | 78.85 | 78.36 | 77.9 | | 20 day EMA | 77.73 | 77.33 | 76.95 | | 35 day EMA | 75.9 | 75.57 | 75.26 | | 50 day EMA | 74.15 | 73.85 | 73.56 |
SMA (simple moving average) of Hdfcamc Hdfcpsubk HDFCPSUBK
| SMA period | SMA current | SMA prev | SMA prev2 | | 5 day SMA | 80.03 | 79.59 | 78.79 | | 12 day SMA | 78.65 | 78.24 | 77.81 | | 20 day SMA | 77.58 | 77.16 | 76.84 | | 35 day SMA | 75.44 | 75.09 | 74.75 | | 50 day SMA | 73.8 | 73.59 | 73.38 | | 100 day SMA | 72.32 | 72.22 | 72.12 | | 150 day SMA | 70.02 | 69.88 | 69.74 | | 200 day SMA | 67.74 | 67.65 | 67.58 |
|
|
