HdfcamcHdfcnext50 HDFCNEXT50 full analysis,charts,indicators,moving averages,SMA,DMA,EMA,ADX,MACD,RSIHdfcamc Hdfcnext50 HDFCNEXT50 WideScreen charts, DMA,SMA,EMA technical analysis, forecast prediction, by indicators ADX,MACD,RSI,CCI NSE stock exchange
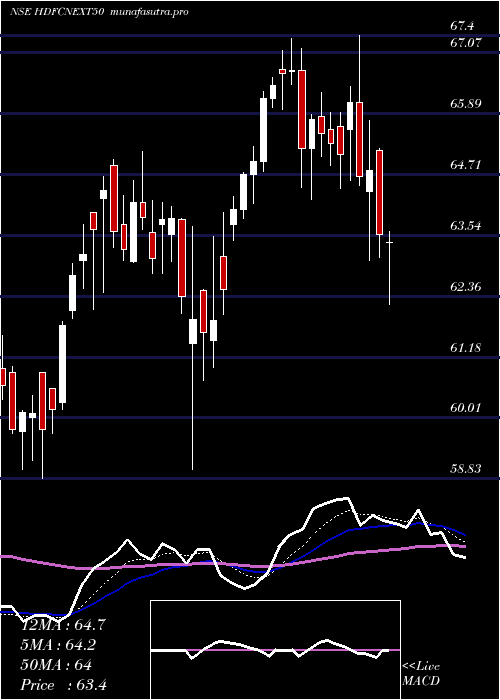
Daily price and charts and targets HdfcamcHdfcnext50 Strong Daily Stock price targets for HdfcamcHdfcnext50 HDFCNEXT50 are 69.77 and 70.81 | Daily Target 1 | 69.55 | | Daily Target 2 | 69.99 | | Daily Target 3 | 70.593333333333 | | Daily Target 4 | 71.03 | | Daily Target 5 | 71.63 |
Daily price and volume Hdfcamc Hdfcnext50
| Date |
Closing |
Open |
Range |
Volume |
Tue 28 October 2025 |
70.42 (-0.61%) |
71.20 |
70.16 - 71.20 |
0.6479 times |
Mon 27 October 2025 |
70.85 (0.4%) |
70.89 |
70.45 - 70.95 |
0.907 times |
Fri 24 October 2025 |
70.57 (0.09%) |
70.71 |
70.19 - 70.89 |
0.4475 times |
Thu 23 October 2025 |
70.51 (-0.31%) |
71.06 |
70.21 - 71.08 |
2.2418 times |
Tue 21 October 2025 |
70.73 (0.23%) |
70.57 |
70.21 - 72.98 |
1.0914 times |
Mon 20 October 2025 |
70.57 (0.18%) |
70.44 |
70.32 - 71.09 |
0.8107 times |
Fri 17 October 2025 |
70.44 (-0.03%) |
70.47 |
70.13 - 70.81 |
1.1741 times |
Thu 16 October 2025 |
70.46 (0.54%) |
70.38 |
70.09 - 70.55 |
1.1901 times |
Wed 15 October 2025 |
70.08 (0.94%) |
69.50 |
69.44 - 70.20 |
1.107 times |
Tue 14 October 2025 |
69.43 (-0.43%) |
69.59 |
69.13 - 69.99 |
0.3826 times |
Mon 13 October 2025 |
69.73 (-0.21%) |
69.20 |
69.13 - 69.90 |
0.5105 times |
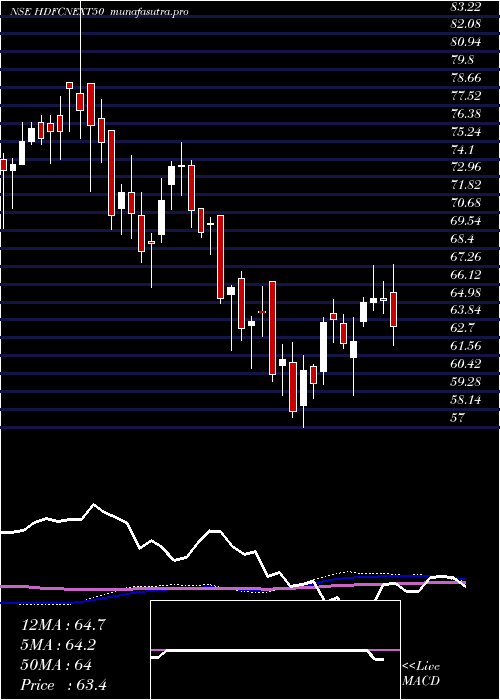
Weekly price and charts HdfcamcHdfcnext50 Strong weekly Stock price targets for HdfcamcHdfcnext50 HDFCNEXT50 are 69.77 and 70.81 | Weekly Target 1 | 69.55 | | Weekly Target 2 | 69.99 | | Weekly Target 3 | 70.593333333333 | | Weekly Target 4 | 71.03 | | Weekly Target 5 | 71.63 |
Weekly price and volumes for Hdfcamc Hdfcnext50
| Date |
Closing |
Open |
Range |
Volume |
Tue 28 October 2025 |
70.42 (-0.21%) |
70.89 |
70.16 - 71.20 |
0.2276 times |
Fri 24 October 2025 |
70.57 (0.18%) |
70.44 |
70.19 - 72.98 |
0.6722 times |
Fri 17 October 2025 |
70.44 (0.8%) |
69.20 |
69.13 - 70.81 |
0.6389 times |
Fri 10 October 2025 |
69.88 (0.68%) |
69.41 |
69.03 - 70.10 |
0.3989 times |
Fri 03 October 2025 |
69.41 (1.23%) |
68.56 |
68.36 - 69.50 |
2.7926 times |
Fri 26 September 2025 |
68.57 (-3.15%) |
70.88 |
68.19 - 73.00 |
2.3244 times |
Fri 19 September 2025 |
70.80 (2.19%) |
69.02 |
67.86 - 70.98 |
1.0007 times |
Fri 12 September 2025 |
69.28 (1.41%) |
68.90 |
66.77 - 69.59 |
1.0311 times |
Fri 05 September 2025 |
68.32 (1.97%) |
64.99 |
64.99 - 69.29 |
0.4941 times |
Fri 29 August 2025 |
67.00 (-2.63%) |
67.08 |
66.75 - 69.50 |
0.4194 times |
Fri 22 August 2025 |
68.81 (1.55%) |
68.10 |
68.05 - 69.55 |
0.5459 times |
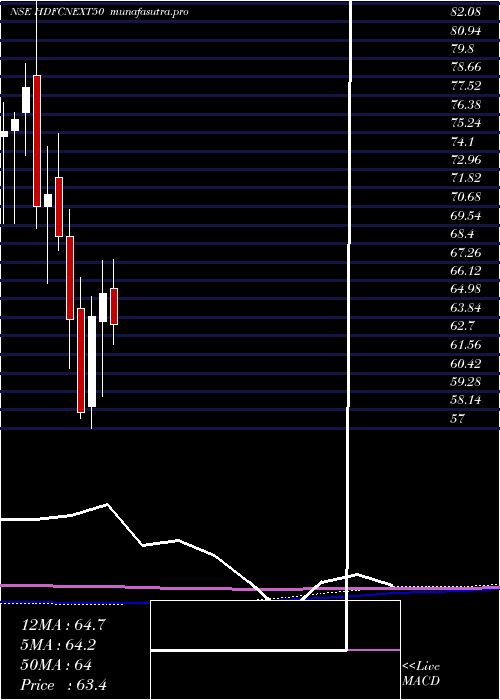
Monthly price and charts HdfcamcHdfcnext50 Strong monthly Stock price targets for HdfcamcHdfcnext50 HDFCNEXT50 are 69.59 and 73.82 | Monthly Target 1 | 66.49 | | Monthly Target 2 | 68.45 | | Monthly Target 3 | 70.716666666667 | | Monthly Target 4 | 72.68 | | Monthly Target 5 | 74.95 |
Monthly price and volumes Hdfcamc Hdfcnext50
| Date |
Closing |
Open |
Range |
Volume |
Tue 28 October 2025 |
70.42 (2.04%) |
69.25 |
68.75 - 72.98 |
0.4619 times |
Tue 30 September 2025 |
69.01 (3%) |
64.99 |
64.99 - 73.00 |
1.6144 times |
Fri 29 August 2025 |
67.00 (-1.85%) |
68.01 |
66.46 - 69.76 |
0.4965 times |
Thu 31 July 2025 |
68.26 (-2.28%) |
71.95 |
66.11 - 71.95 |
0.6305 times |
Mon 30 June 2025 |
69.85 (3.25%) |
67.93 |
66.00 - 70.77 |
0.8513 times |
Fri 30 May 2025 |
67.65 (3.58%) |
65.64 |
62.19 - 68.85 |
0.9603 times |
Wed 30 April 2025 |
65.31 (2.25%) |
63.59 |
59.00 - 67.34 |
1.0092 times |
Fri 28 March 2025 |
63.87 (10.1%) |
58.38 |
57.00 - 65.15 |
1.0355 times |
Fri 28 February 2025 |
58.01 (-8.95%) |
64.40 |
57.60 - 66.30 |
1.7101 times |
Fri 31 January 2025 |
63.71 (-7.48%) |
68.85 |
60.72 - 70.48 |
1.2303 times |
Tue 31 December 2024 |
68.86 (-3.6%) |
72.48 |
67.99 - 75.18 |
0.7844 times |
DMA SMA EMA moving averages of Hdfcamc Hdfcnext50 HDFCNEXT50
DMA (daily moving average) of Hdfcamc Hdfcnext50 HDFCNEXT50
| DMA period | DMA value | | 5 day DMA | 70.62 | | 12 day DMA | 70.31 | | 20 day DMA | 69.92 | | 35 day DMA | 69.84 | | 50 day DMA | 69.39 | | 100 day DMA | 69 | | 150 day DMA | 67.81 | | 200 day DMA | 66.45 | EMA (exponential moving average) of Hdfcamc Hdfcnext50 HDFCNEXT50
| EMA period | EMA current | EMA prev | EMA prev2 | | 5 day EMA | 70.55 | 70.62 | 70.5 | | 12 day EMA | 70.34 | 70.32 | 70.22 | | 20 day EMA | 70.11 | 70.08 | 70 | | 35 day EMA | 69.68 | 69.64 | 69.57 | | 50 day EMA | 69.34 | 69.3 | 69.24 |
SMA (simple moving average) of Hdfcamc Hdfcnext50 HDFCNEXT50
| SMA period | SMA current | SMA prev | SMA prev2 | | 5 day SMA | 70.62 | 70.65 | 70.56 | | 12 day SMA | 70.31 | 70.23 | 70.1 | | 20 day SMA | 69.92 | 69.82 | 69.75 | | 35 day SMA | 69.84 | 69.78 | 69.71 | | 50 day SMA | 69.39 | 69.34 | 69.27 | | 100 day SMA | 69 | 68.97 | 68.94 | | 150 day SMA | 67.81 | 67.75 | 67.69 | | 200 day SMA | 66.45 | 66.44 | 66.43 |
|
|
