HdfcGold HDFCGOLD full analysis,charts,indicators,moving averages,SMA,DMA,EMA,ADX,MACD,RSIHdfc Gold HDFCGOLD WideScreen charts, DMA,SMA,EMA technical analysis, forecast prediction, by indicators ADX,MACD,RSI,CCI NSE stock exchange
Daily price and charts and targets HdfcGold Strong Daily Stock price targets for HdfcGold HDFCGOLD are 109.32 and 110.57 | Daily Target 1 | 108.35 | | Daily Target 2 | 109.03 | | Daily Target 3 | 109.60333333333 | | Daily Target 4 | 110.28 | | Daily Target 5 | 110.85 |
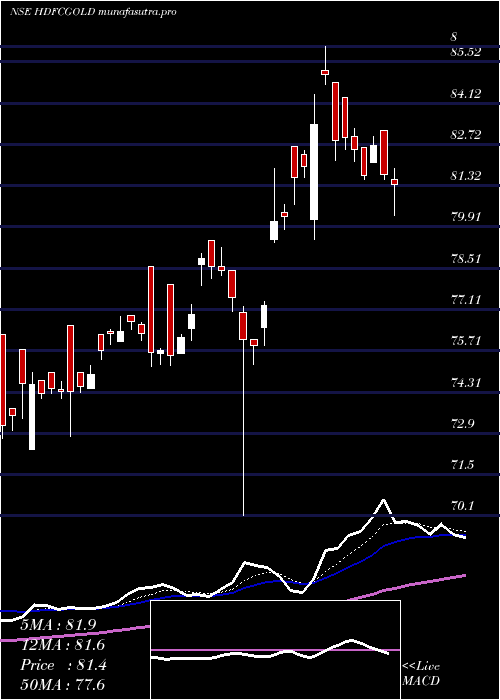
Daily price and volume Hdfc Gold
| Date |
Closing |
Open |
Range |
Volume |
Tue 09 December 2025 |
109.70 (-0.5%) |
109.42 |
108.93 - 110.18 |
0.895 times |
Mon 08 December 2025 |
110.25 (-0.04%) |
100.80 |
100.80 - 110.54 |
1.1881 times |
Fri 05 December 2025 |
110.29 (0.62%) |
109.11 |
109.11 - 110.45 |
1.0301 times |
Thu 04 December 2025 |
109.61 (-0.29%) |
107.18 |
107.18 - 111.13 |
0.8918 times |
Wed 03 December 2025 |
109.93 (0.51%) |
109.98 |
109.55 - 110.37 |
1.3553 times |
Tue 02 December 2025 |
109.37 (-0.81%) |
110.20 |
109.15 - 110.20 |
1.1866 times |
Mon 01 December 2025 |
110.26 (2.19%) |
109.90 |
109.10 - 110.50 |
1.3977 times |
Fri 28 November 2025 |
107.90 (0.33%) |
104.86 |
104.86 - 108.33 |
0.8159 times |
Thu 27 November 2025 |
107.55 (-0.09%) |
107.60 |
107.05 - 107.69 |
0.6548 times |
Wed 26 November 2025 |
107.65 (0.8%) |
107.32 |
107.31 - 107.79 |
0.5846 times |
Tue 25 November 2025 |
106.80 (1.22%) |
107.36 |
106.30 - 107.36 |
0.7468 times |
Weekly price and charts HdfcGold Strong weekly Stock price targets for HdfcGold HDFCGOLD are 105.25 and 114.99 | Weekly Target 1 | 97.27 | | Weekly Target 2 | 103.49 | | Weekly Target 3 | 107.01333333333 | | Weekly Target 4 | 113.23 | | Weekly Target 5 | 116.75 |
Weekly price and volumes for Hdfc Gold
| Date |
Closing |
Open |
Range |
Volume |
Tue 09 December 2025 |
109.70 (-0.53%) |
100.80 |
100.80 - 110.54 |
0.3035 times |
Fri 05 December 2025 |
110.29 (2.22%) |
109.90 |
107.18 - 111.13 |
0.854 times |
Fri 28 November 2025 |
107.90 (2.46%) |
105.30 |
104.81 - 108.33 |
0.4895 times |
Fri 21 November 2025 |
105.31 (-1.72%) |
105.18 |
103.20 - 105.80 |
0.7159 times |
Fri 14 November 2025 |
107.15 (3.83%) |
105.40 |
103.72 - 108.70 |
0.7702 times |
Fri 07 November 2025 |
103.20 (-0.04%) |
103.80 |
102.21 - 103.80 |
0.4679 times |
Fri 31 October 2025 |
103.24 (-0.06%) |
103.40 |
99.57 - 104.80 |
1.0614 times |
Fri 24 October 2025 |
103.30 (-7.4%) |
111.03 |
95.68 - 111.65 |
1.0677 times |
Fri 17 October 2025 |
111.56 (7.29%) |
106.57 |
104.66 - 112.80 |
2.1286 times |
Fri 10 October 2025 |
103.98 (3.7%) |
102.50 |
100.58 - 105.84 |
2.1412 times |
Fri 03 October 2025 |
100.27 (3.08%) |
98.70 |
97.85 - 102.70 |
1.4954 times |
Monthly price and charts HdfcGold Strong monthly Stock price targets for HdfcGold HDFCGOLD are 100.09 and 110.42 | Monthly Target 1 | 96.88 | | Monthly Target 2 | 103.29 | | Monthly Target 3 | 107.21 | | Monthly Target 4 | 113.62 | | Monthly Target 5 | 117.54 |
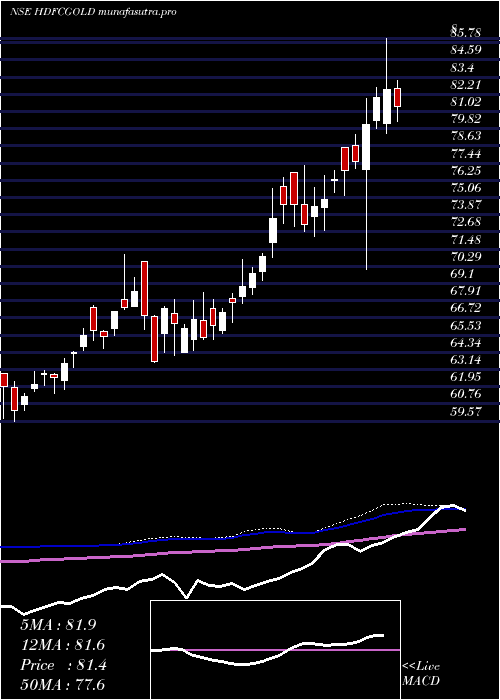
Monthly price and volumes Hdfc Gold
| Date |
Closing |
Open |
Range |
Volume |
Tue 09 December 2025 |
109.70 (1.67%) |
109.90 |
100.80 - 111.13 |
0.3863 times |
Fri 28 November 2025 |
107.90 (4.51%) |
103.80 |
102.21 - 108.70 |
0.8154 times |
Fri 31 October 2025 |
103.24 (4.03%) |
100.70 |
95.68 - 112.80 |
2.4024 times |
Tue 30 September 2025 |
99.24 (12.73%) |
89.20 |
89.10 - 100.85 |
1.9936 times |
Fri 29 August 2025 |
88.03 (3.82%) |
86.90 |
83.43 - 88.87 |
0.6054 times |
Thu 31 July 2025 |
84.79 (2.74%) |
85.01 |
81.19 - 87.74 |
0.5342 times |
Mon 30 June 2025 |
82.53 (0.44%) |
82.49 |
81.54 - 87.91 |
0.8132 times |
Fri 30 May 2025 |
82.17 (0.59%) |
81.51 |
78.90 - 85.36 |
0.7784 times |
Wed 30 April 2025 |
81.69 (6.2%) |
78.64 |
70.10 - 86.04 |
1.02 times |
Fri 28 March 2025 |
76.92 (5.14%) |
73.74 |
72.35 - 78.55 |
0.6511 times |
Fri 28 February 2025 |
73.16 (3.04%) |
71.95 |
70.92 - 77.30 |
0.7361 times |

DMA SMA EMA moving averages of Hdfc Gold HDFCGOLD
DMA (daily moving average) of Hdfc Gold HDFCGOLD
| DMA period | DMA value | | 5 day DMA | 109.96 | | 12 day DMA | 108.74 | | 20 day DMA | 107.58 | | 35 day DMA | 106.12 | | 50 day DMA | 105.48 | | 100 day DMA | 97.06 | | 150 day DMA | 92.43 | | 200 day DMA | 88.71 | EMA (exponential moving average) of Hdfc Gold HDFCGOLD
| EMA period | EMA current | EMA prev | EMA prev2 | | 5 day EMA | 109.77 | 109.8 | 109.58 | | 12 day EMA | 108.83 | 108.67 | 108.38 | | 20 day EMA | 107.84 | 107.64 | 107.36 | | 35 day EMA | 106.49 | 106.3 | 106.07 | | 50 day EMA | 105.2 | 105.02 | 104.81 |
SMA (simple moving average) of Hdfc Gold HDFCGOLD
| SMA period | SMA current | SMA prev | SMA prev2 | | 5 day SMA | 109.96 | 109.89 | 109.89 | | 12 day SMA | 108.74 | 108.37 | 107.92 | | 20 day SMA | 107.58 | 107.43 | 107.16 | | 35 day SMA | 106.12 | 106.18 | 106.13 | | 50 day SMA | 105.48 | 105.23 | 104.98 | | 100 day SMA | 97.06 | 96.81 | 96.55 | | 150 day SMA | 92.43 | 92.26 | 92.07 | | 200 day SMA | 88.71 | 88.54 | 88.36 |
|
|
