HdfcamcHdfcbse500 HDFCBSE500 full analysis,charts,indicators,moving averages,SMA,DMA,EMA,ADX,MACD,RSIHdfcamc Hdfcbse500 HDFCBSE500 WideScreen charts, DMA,SMA,EMA technical analysis, forecast prediction, by indicators ADX,MACD,RSI,CCI NSE stock exchange
Daily price and charts and targets HdfcamcHdfcbse500 Strong Daily Stock price targets for HdfcamcHdfcbse500 HDFCBSE500 are 37.63 and 37.98 | Daily Target 1 | 37.55 | | Daily Target 2 | 37.7 | | Daily Target 3 | 37.896666666667 | | Daily Target 4 | 38.05 | | Daily Target 5 | 38.25 |
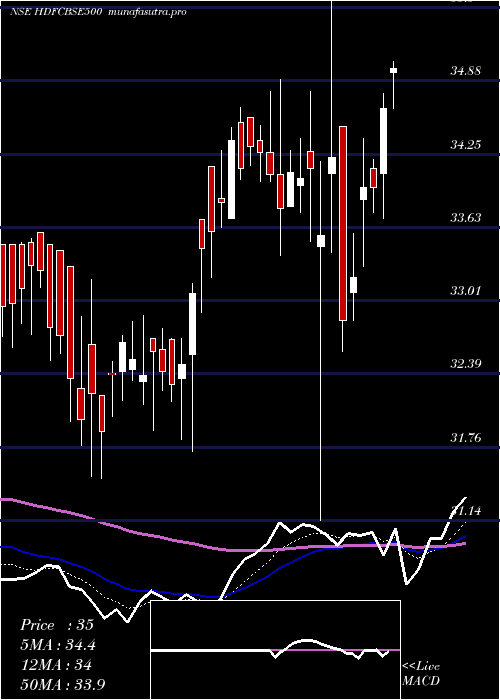
Daily price and volume Hdfcamc Hdfcbse500
| Date |
Closing |
Open |
Range |
Volume |
Tue 28 October 2025 |
37.86 (-0.03%) |
38.08 |
37.74 - 38.09 |
0.5505 times |
Mon 27 October 2025 |
37.87 (0.4%) |
37.72 |
37.61 - 37.99 |
0.8292 times |
Fri 24 October 2025 |
37.72 (-0.84%) |
38.08 |
37.40 - 38.09 |
1.2356 times |
Thu 23 October 2025 |
38.04 (0.69%) |
38.00 |
37.86 - 38.70 |
1.5649 times |
Tue 21 October 2025 |
37.78 (0%) |
38.72 |
37.76 - 38.72 |
0.4725 times |
Mon 20 October 2025 |
37.78 (0.59%) |
37.76 |
37.56 - 37.98 |
1.0869 times |
Fri 17 October 2025 |
37.56 (-0.19%) |
37.68 |
37.51 - 37.70 |
0.3509 times |
Thu 16 October 2025 |
37.63 (0.48%) |
37.45 |
37.31 - 37.65 |
2.7592 times |
Wed 15 October 2025 |
37.45 (0.51%) |
37.26 |
37.19 - 37.49 |
0.353 times |
Tue 14 October 2025 |
37.26 (-0.53%) |
37.63 |
37.02 - 37.88 |
0.7974 times |
Mon 13 October 2025 |
37.46 (-0.19%) |
37.98 |
37.31 - 37.99 |
0.4375 times |
Weekly price and charts HdfcamcHdfcbse500 Strong weekly Stock price targets for HdfcamcHdfcbse500 HDFCBSE500 are 37.74 and 38.22 | Weekly Target 1 | 37.37 | | Weekly Target 2 | 37.62 | | Weekly Target 3 | 37.853333333333 | | Weekly Target 4 | 38.1 | | Weekly Target 5 | 38.33 |
Weekly price and volumes for Hdfcamc Hdfcbse500
| Date |
Closing |
Open |
Range |
Volume |
Tue 28 October 2025 |
37.86 (0.37%) |
37.72 |
37.61 - 38.09 |
0.3219 times |
Fri 24 October 2025 |
37.72 (0.43%) |
37.76 |
37.40 - 38.72 |
1.0174 times |
Fri 17 October 2025 |
37.56 (0.08%) |
37.98 |
37.02 - 37.99 |
1.0963 times |
Fri 10 October 2025 |
37.53 (-1%) |
38.85 |
36.96 - 38.85 |
0.967 times |
Fri 03 October 2025 |
37.91 (3.49%) |
36.89 |
36.48 - 38.48 |
1.3003 times |
Fri 26 September 2025 |
36.63 (-1.98%) |
38.12 |
36.51 - 38.36 |
2.5614 times |
Fri 19 September 2025 |
37.37 (0.67%) |
37.46 |
36.82 - 37.69 |
0.7124 times |
Fri 12 September 2025 |
37.12 (1.2%) |
35.76 |
35.76 - 37.28 |
0.6444 times |
Fri 05 September 2025 |
36.68 (0.71%) |
36.86 |
36.31 - 37.08 |
0.8348 times |
Fri 29 August 2025 |
36.42 (-1.14%) |
36.83 |
36.30 - 37.38 |
0.5441 times |
Fri 22 August 2025 |
36.84 (1.4%) |
37.23 |
36.41 - 37.65 |
0.63 times |

Monthly price and charts HdfcamcHdfcbse500 Strong monthly Stock price targets for HdfcamcHdfcbse500 HDFCBSE500 are 37.17 and 39.54 | Monthly Target 1 | 35.36 | | Monthly Target 2 | 36.61 | | Monthly Target 3 | 37.73 | | Monthly Target 4 | 38.98 | | Monthly Target 5 | 40.1 |
Monthly price and volumes Hdfcamc Hdfcbse500
| Date |
Closing |
Open |
Range |
Volume |
Tue 28 October 2025 |
37.86 (1.18%) |
36.48 |
36.48 - 38.85 |
0.8542 times |
Tue 30 September 2025 |
37.42 (2.75%) |
36.86 |
35.76 - 38.36 |
1.187 times |
Fri 29 August 2025 |
36.42 (-0.74%) |
36.81 |
35.84 - 37.65 |
0.6224 times |
Thu 31 July 2025 |
36.69 (-2.45%) |
37.89 |
36.55 - 39.55 |
1.2109 times |
Mon 30 June 2025 |
37.61 (3.49%) |
36.48 |
35.74 - 38.50 |
0.9961 times |
Fri 30 May 2025 |
36.34 (3.12%) |
35.11 |
34.51 - 38.00 |
0.9235 times |
Wed 30 April 2025 |
35.24 (3.4%) |
34.08 |
31.14 - 35.72 |
1.1049 times |
Fri 28 March 2025 |
34.08 (6.5%) |
32.64 |
31.50 - 34.79 |
0.8031 times |
Fri 28 February 2025 |
32.00 (-6.65%) |
34.34 |
31.78 - 35.70 |
0.8576 times |
Fri 31 January 2025 |
34.28 (-5.69%) |
36.48 |
32.10 - 38.40 |
1.4404 times |
Tue 31 December 2024 |
36.35 (0.19%) |
36.27 |
35.51 - 37.75 |
0.869 times |

DMA SMA EMA moving averages of Hdfcamc Hdfcbse500 HDFCBSE500
DMA (daily moving average) of Hdfcamc Hdfcbse500 HDFCBSE500
| DMA period | DMA value | | 5 day DMA | 37.85 | | 12 day DMA | 37.66 | | 20 day DMA | 37.61 | | 35 day DMA | 37.4 | | 50 day DMA | 37.18 | | 100 day DMA | 37.2 | | 150 day DMA | 36.5 | | 200 day DMA | 35.81 | EMA (exponential moving average) of Hdfcamc Hdfcbse500 HDFCBSE500
| EMA period | EMA current | EMA prev | EMA prev2 | | 5 day EMA | 37.82 | 37.8 | 37.77 | | 12 day EMA | 37.71 | 37.68 | 37.64 | | 20 day EMA | 37.6 | 37.57 | 37.54 | | 35 day EMA | 37.39 | 37.36 | 37.33 | | 50 day EMA | 37.17 | 37.14 | 37.11 |
SMA (simple moving average) of Hdfcamc Hdfcbse500 HDFCBSE500
| SMA period | SMA current | SMA prev | SMA prev2 | | 5 day SMA | 37.85 | 37.84 | 37.78 | | 12 day SMA | 37.66 | 37.62 | 37.61 | | 20 day SMA | 37.61 | 37.55 | 37.5 | | 35 day SMA | 37.4 | 37.36 | 37.33 | | 50 day SMA | 37.18 | 37.15 | 37.11 | | 100 day SMA | 37.2 | 37.19 | 37.17 | | 150 day SMA | 36.5 | 36.47 | 36.44 | | 200 day SMA | 35.81 | 35.81 | 35.8 |
|
|
