HealthcareGlob HCG full analysis,charts,indicators,moving averages,SMA,DMA,EMA,ADX,MACD,RSIHealthcare Glob HCG WideScreen charts, DMA,SMA,EMA technical analysis, forecast prediction, by indicators ADX,MACD,RSI,CCI NSE stock exchange
Daily price and charts and targets HealthcareGlob Strong Daily Stock price targets for HealthcareGlob HCG are 721.75 and 743.25 | Daily Target 1 | 705.17 | | Daily Target 2 | 716.83 | | Daily Target 3 | 726.66666666667 | | Daily Target 4 | 738.33 | | Daily Target 5 | 748.17 |
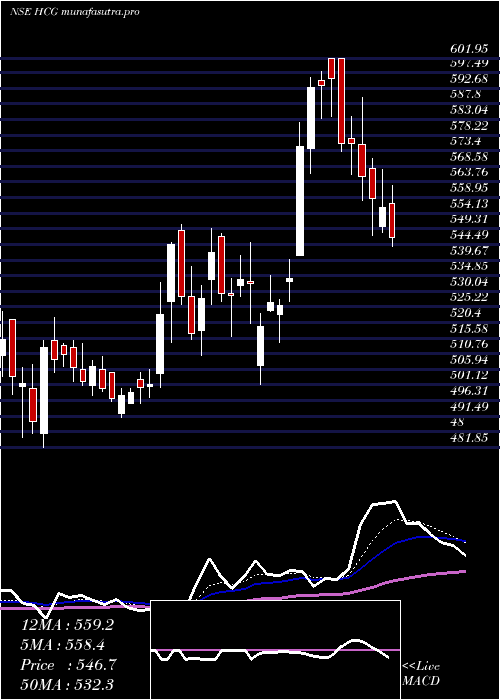
Daily price and volume Healthcare Glob
| Date |
Closing |
Open |
Range |
Volume |
Tue 28 October 2025 |
728.50 (1.05%) |
721.00 |
715.00 - 736.50 |
0.4756 times |
Mon 27 October 2025 |
720.90 (-5.03%) |
758.60 |
712.20 - 761.15 |
1.6102 times |
Fri 24 October 2025 |
759.10 (4.19%) |
729.80 |
720.00 - 804.65 |
0.6589 times |
Thu 23 October 2025 |
728.55 (1.03%) |
721.10 |
719.75 - 743.45 |
0.6677 times |
Tue 21 October 2025 |
721.10 (-1.73%) |
722.75 |
710.00 - 729.00 |
0.1724 times |
Mon 20 October 2025 |
733.80 (0.03%) |
725.00 |
710.00 - 741.05 |
0.933 times |
Fri 17 October 2025 |
733.55 (3.42%) |
712.00 |
707.00 - 744.50 |
2.3603 times |
Thu 16 October 2025 |
709.30 (3.41%) |
686.50 |
680.00 - 718.00 |
2.6028 times |
Wed 15 October 2025 |
685.90 (-1%) |
692.90 |
678.90 - 693.00 |
0.1508 times |
Tue 14 October 2025 |
692.80 (-0.23%) |
699.00 |
676.00 - 701.95 |
0.3685 times |
Mon 13 October 2025 |
694.40 (0.6%) |
688.60 |
675.40 - 699.00 |
0.6128 times |
Weekly price and charts HealthcareGlob Strong weekly Stock price targets for HealthcareGlob HCG are 695.88 and 744.83 | Weekly Target 1 | 685 | | Weekly Target 2 | 706.75 | | Weekly Target 3 | 733.95 | | Weekly Target 4 | 755.7 | | Weekly Target 5 | 782.9 |
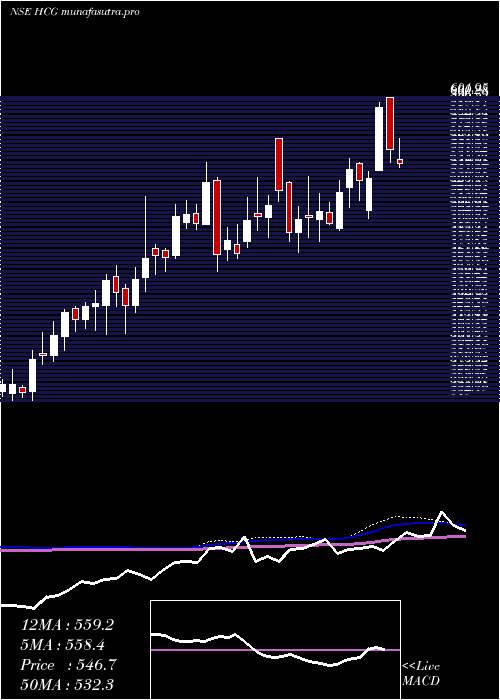
Weekly price and volumes for Healthcare Glob
| Date |
Closing |
Open |
Range |
Volume |
Tue 28 October 2025 |
728.50 (-4.03%) |
758.60 |
712.20 - 761.15 |
0.7137 times |
Fri 24 October 2025 |
759.10 (3.48%) |
725.00 |
710.00 - 804.65 |
0.8321 times |
Fri 17 October 2025 |
733.55 (6.27%) |
688.60 |
675.40 - 744.50 |
2.0856 times |
Fri 10 October 2025 |
690.25 (7.18%) |
652.00 |
644.10 - 704.60 |
1.155 times |
Fri 03 October 2025 |
644.00 (-0.53%) |
630.00 |
613.75 - 654.80 |
1.2094 times |
Fri 26 September 2025 |
647.40 (-0.01%) |
645.90 |
638.50 - 665.60 |
0.5366 times |
Fri 19 September 2025 |
647.45 (-4.56%) |
679.75 |
633.60 - 693.70 |
0.5951 times |
Fri 12 September 2025 |
678.40 (-1.79%) |
693.50 |
658.35 - 704.65 |
1.8472 times |
Fri 05 September 2025 |
690.75 (2.52%) |
673.75 |
661.60 - 708.00 |
0.6721 times |
Fri 29 August 2025 |
673.75 (-0.58%) |
679.95 |
668.55 - 695.00 |
0.3531 times |
Fri 22 August 2025 |
677.70 (2.51%) |
661.00 |
643.65 - 701.10 |
0.7749 times |
Monthly price and charts HealthcareGlob Strong monthly Stock price targets for HealthcareGlob HCG are 679.55 and 853.6 | Monthly Target 1 | 547.2 | | Monthly Target 2 | 637.85 | | Monthly Target 3 | 721.25 | | Monthly Target 4 | 811.9 | | Monthly Target 5 | 895.3 |
Monthly price and volumes Healthcare Glob
| Date |
Closing |
Open |
Range |
Volume |
Tue 28 October 2025 |
728.50 (13.24%) |
640.35 |
630.60 - 804.65 |
1.3595 times |
Tue 30 September 2025 |
643.30 (-4.52%) |
673.75 |
613.75 - 708.00 |
1.2703 times |
Fri 29 August 2025 |
673.75 (8.31%) |
622.05 |
583.05 - 701.10 |
0.7418 times |
Thu 31 July 2025 |
622.05 (12.98%) |
550.60 |
531.35 - 626.45 |
0.7631 times |
Mon 30 June 2025 |
550.60 (1.51%) |
556.95 |
520.10 - 560.90 |
0.728 times |
Fri 30 May 2025 |
542.40 (-3.56%) |
565.25 |
526.10 - 639.00 |
1.0778 times |
Wed 30 April 2025 |
562.45 (3.75%) |
547.00 |
501.25 - 601.95 |
1.1038 times |
Fri 28 March 2025 |
542.10 (8.06%) |
500.00 |
481.85 - 550.75 |
0.8461 times |
Fri 28 February 2025 |
501.65 (-1.98%) |
567.70 |
472.55 - 567.70 |
0.9428 times |
Fri 31 January 2025 |
511.80 (4.63%) |
492.00 |
468.00 - 535.00 |
1.1668 times |
Tue 31 December 2024 |
489.15 (-2.64%) |
497.40 |
456.95 - 548.00 |
1.2511 times |

DMA SMA EMA moving averages of Healthcare Glob HCG
DMA (daily moving average) of Healthcare Glob HCG
| DMA period | DMA value | | 5 day DMA | 731.63 | | 12 day DMA | 716.51 | | 20 day DMA | 691.27 | | 35 day DMA | 681.96 | | 50 day DMA | 680.74 | | 100 day DMA | 625.49 | | 150 day DMA | 603.48 | | 200 day DMA | 578.51 | EMA (exponential moving average) of Healthcare Glob HCG
| EMA period | EMA current | EMA prev | EMA prev2 | | 5 day EMA | 729.17 | 729.51 | 733.81 | | 12 day EMA | 715.84 | 713.54 | 712.2 | | 20 day EMA | 703.27 | 700.61 | 698.48 | | 35 day EMA | 691.89 | 689.73 | 687.9 | | 50 day EMA | 683.03 | 681.17 | 679.55 |
SMA (simple moving average) of Healthcare Glob HCG
| SMA period | SMA current | SMA prev | SMA prev2 | | 5 day SMA | 731.63 | 732.69 | 735.22 | | 12 day SMA | 716.51 | 712.78 | 708.25 | | 20 day SMA | 691.27 | 687.21 | 683.93 | | 35 day SMA | 681.96 | 680.88 | 680.16 | | 50 day SMA | 680.74 | 679.8 | 678.81 | | 100 day SMA | 625.49 | 623.74 | 621.98 | | 150 day SMA | 603.48 | 601.96 | 600.48 | | 200 day SMA | 578.51 | 577.24 | 576.05 |
|
|
