HbStockholdings HBSL_BE full analysis,charts,indicators,moving averages,SMA,DMA,EMA,ADX,MACD,RSIHb Stockholdings HBSL_BE WideScreen charts, DMA,SMA,EMA technical analysis, forecast prediction, by indicators ADX,MACD,RSI,CCI NSE stock exchange
Daily price and charts and targets HbStockholdings Strong Daily Stock price targets for HbStockholdings HBSL_BE are 71.74 and 74.64 | Daily Target 1 | 70.89 | | Daily Target 2 | 72.59 | | Daily Target 3 | 73.793333333333 | | Daily Target 4 | 75.49 | | Daily Target 5 | 76.69 |
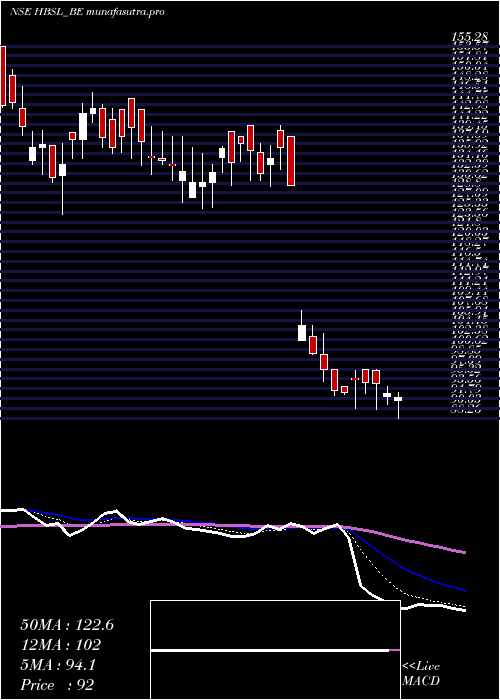
Daily price and volume Hb Stockholdings
| Date |
Closing |
Open |
Range |
Volume |
Tue 09 December 2025 |
74.28 (-0.96%) |
75.00 |
72.10 - 75.00 |
0.9907 times |
Mon 08 December 2025 |
75.00 (-2.47%) |
78.50 |
73.15 - 78.50 |
0.7539 times |
Fri 05 December 2025 |
76.90 (0.77%) |
77.97 |
76.02 - 77.97 |
0.6372 times |
Thu 04 December 2025 |
76.31 (-0.04%) |
76.83 |
75.10 - 78.65 |
0.6917 times |
Wed 03 December 2025 |
76.34 (-0.64%) |
77.00 |
75.61 - 78.50 |
0.6829 times |
Tue 02 December 2025 |
76.83 (-1.11%) |
77.00 |
75.80 - 77.99 |
1.3365 times |
Mon 01 December 2025 |
77.69 (0.06%) |
77.65 |
77.00 - 78.77 |
0.875 times |
Fri 28 November 2025 |
77.64 (-0.31%) |
77.88 |
77.10 - 79.85 |
1.106 times |
Thu 27 November 2025 |
77.88 (0.08%) |
78.00 |
77.10 - 79.53 |
0.7627 times |
Wed 26 November 2025 |
77.82 (0.43%) |
77.49 |
77.11 - 79.15 |
2.1633 times |
Tue 25 November 2025 |
77.49 (-1.42%) |
78.00 |
77.00 - 79.56 |
2.3369 times |
Weekly price and charts HbStockholdings Strong weekly Stock price targets for HbStockholdings HBSL_BE are 69.99 and 76.39 | Weekly Target 1 | 68.56 | | Weekly Target 2 | 71.42 | | Weekly Target 3 | 74.96 | | Weekly Target 4 | 77.82 | | Weekly Target 5 | 81.36 |
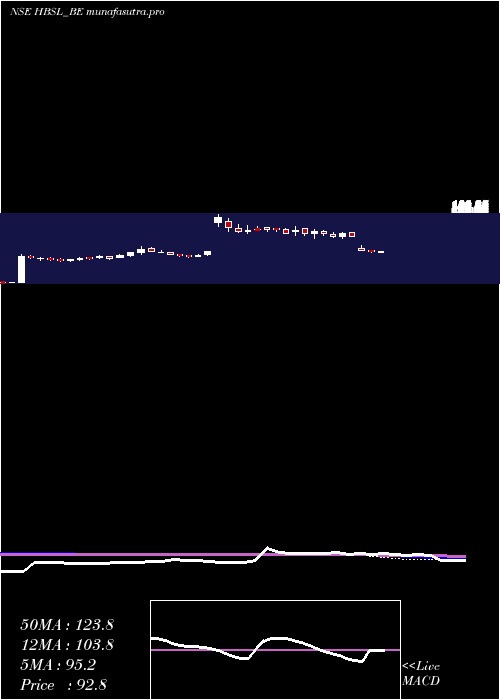
Weekly price and volumes for Hb Stockholdings
| Date |
Closing |
Open |
Range |
Volume |
Tue 09 December 2025 |
74.28 (-3.41%) |
78.50 |
72.10 - 78.50 |
0.2428 times |
Fri 05 December 2025 |
76.90 (-0.95%) |
77.65 |
75.10 - 78.77 |
0.5877 times |
Fri 28 November 2025 |
77.64 (-3.68%) |
78.60 |
77.00 - 79.85 |
1.1356 times |
Fri 21 November 2025 |
80.61 (-3.94%) |
84.45 |
78.51 - 85.00 |
1.5208 times |
Fri 14 November 2025 |
83.92 (0.12%) |
84.20 |
78.90 - 85.74 |
2.3866 times |
Fri 03 October 2025 |
83.82 (8.74%) |
80.88 |
76.10 - 83.98 |
1.4084 times |
Fri 26 September 2025 |
77.08 (0.75%) |
76.51 |
75.40 - 78.99 |
0.6537 times |
Fri 19 September 2025 |
76.51 (-1.65%) |
77.79 |
75.50 - 79.50 |
0.8328 times |
Fri 12 September 2025 |
77.79 (2.63%) |
77.99 |
74.00 - 78.50 |
0.6039 times |
Fri 05 September 2025 |
75.80 (-0.35%) |
76.10 |
74.51 - 80.00 |
0.6278 times |
Fri 29 August 2025 |
76.07 (-3.95%) |
78.00 |
73.71 - 80.98 |
0.4687 times |
Monthly price and charts HbStockholdings Strong monthly Stock price targets for HbStockholdings HBSL_BE are 69.86 and 76.53 | Monthly Target 1 | 68.38 | | Monthly Target 2 | 71.33 | | Monthly Target 3 | 75.05 | | Monthly Target 4 | 78 | | Monthly Target 5 | 81.72 |
Monthly price and volumes Hb Stockholdings
| Date |
Closing |
Open |
Range |
Volume |
Tue 09 December 2025 |
74.28 (-4.33%) |
77.65 |
72.10 - 78.77 |
0.1845 times |
Fri 28 November 2025 |
77.64 (-7.37%) |
84.20 |
77.00 - 85.74 |
1.1202 times |
Fri 03 October 2025 |
83.82 (4.98%) |
80.99 |
78.90 - 83.98 |
0.1354 times |
Tue 30 September 2025 |
79.84 (4.96%) |
76.10 |
74.00 - 81.50 |
0.7812 times |
Fri 29 August 2025 |
76.07 (-5.31%) |
79.44 |
73.71 - 82.46 |
0.4191 times |
Thu 31 July 2025 |
80.34 (-38.29%) |
102.19 |
78.00 - 107.70 |
2.1768 times |
Fri 08 November 2024 |
130.19 (-3.14%) |
138.95 |
130.00 - 141.00 |
0.3239 times |
Thu 31 October 2024 |
134.41 (-7.38%) |
144.00 |
125.02 - 148.00 |
1.1731 times |
Mon 30 September 2024 |
145.12 (-1.54%) |
152.99 |
134.01 - 156.14 |
1.2195 times |
Fri 30 August 2024 |
147.39 (-16.81%) |
179.80 |
138.99 - 186.02 |
2.4664 times |
Wed 31 July 2024 |
177.17 (91.43%) |
165.00 |
155.20 - 178.00 |
0.696 times |
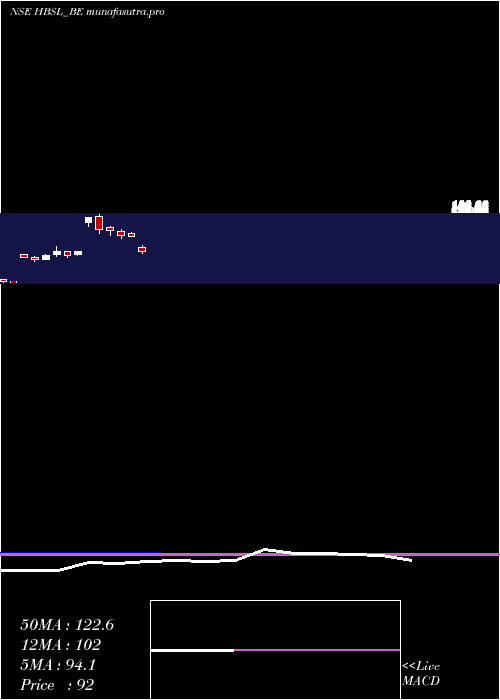
DMA SMA EMA moving averages of Hb Stockholdings HBSL_BE
DMA (daily moving average) of Hb Stockholdings HBSL_BE
| DMA period | DMA value | | 5 day DMA | 75.77 | | 12 day DMA | 76.9 | | 20 day DMA | 79.13 | | 35 day DMA | 78.38 | | 50 day DMA | 78.1 | | 100 day DMA | 89.77 | | 150 day DMA | 108.26 | | 200 day DMA | 105.77 | EMA (exponential moving average) of Hb Stockholdings HBSL_BE
| EMA period | EMA current | EMA prev | EMA prev2 | | 5 day EMA | 75.61 | 76.27 | 76.91 | | 12 day EMA | 76.91 | 77.39 | 77.82 | | 20 day EMA | 77.64 | 77.99 | 78.3 | | 35 day EMA | 77.97 | 78.19 | 78.38 | | 50 day EMA | 77.83 | 77.97 | 78.09 |
SMA (simple moving average) of Hb Stockholdings HBSL_BE
| SMA period | SMA current | SMA prev | SMA prev2 | | 5 day SMA | 75.77 | 76.28 | 76.81 | | 12 day SMA | 76.9 | 77.43 | 78.05 | | 20 day SMA | 79.13 | 79.45 | 79.69 | | 35 day SMA | 78.38 | 78.42 | 78.45 | | 50 day SMA | 78.1 | 78.15 | 78.18 | | 100 day SMA | 89.77 | 90.44 | 91.07 | | 150 day SMA | 108.26 | 108.83 | 109.46 | | 200 day SMA | 105.77 | 105.82 | 105.86 |
|
|
