HardwynIndia HARDWYN full analysis,charts,indicators,moving averages,SMA,DMA,EMA,ADX,MACD,RSIHardwyn India HARDWYN WideScreen charts, DMA,SMA,EMA technical analysis, forecast prediction, by indicators ADX,MACD,RSI,CCI NSE stock exchange
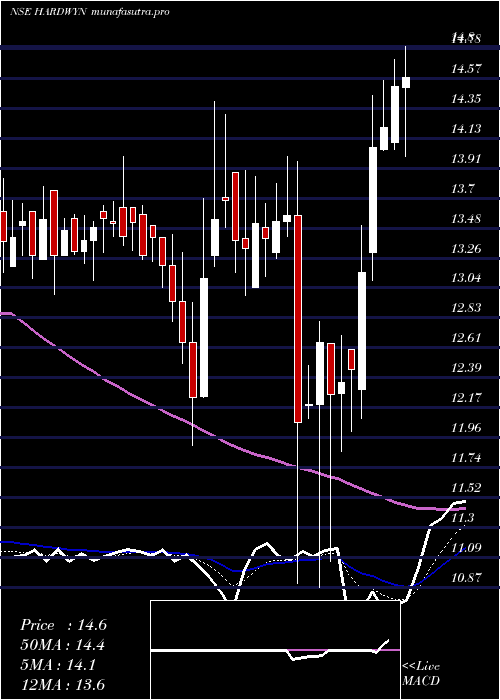
Daily price and charts and targets HardwynIndia Strong Daily Stock price targets for HardwynIndia HARDWYN are 14.29 and 15.09 | Daily Target 1 | 13.66 | | Daily Target 2 | 14.11 | | Daily Target 3 | 14.456666666667 | | Daily Target 4 | 14.91 | | Daily Target 5 | 15.26 |
Daily price and volume Hardwyn India
| Date |
Closing |
Open |
Range |
Volume |
Wed 29 October 2025 |
14.57 (0.41%) |
14.50 |
14.00 - 14.80 |
0.7007 times |
Tue 28 October 2025 |
14.51 (2.11%) |
14.10 |
14.05 - 14.70 |
1.1608 times |
Mon 27 October 2025 |
14.21 (1.07%) |
14.05 |
14.04 - 14.55 |
1.7627 times |
Fri 24 October 2025 |
14.06 (6.84%) |
13.30 |
13.10 - 14.44 |
1.5741 times |
Thu 23 October 2025 |
13.16 (5.7%) |
12.31 |
12.10 - 13.50 |
2.1005 times |
Tue 21 October 2025 |
12.45 (0.73%) |
12.60 |
12.00 - 12.60 |
0.0435 times |
Mon 20 October 2025 |
12.36 (0.73%) |
12.28 |
11.86 - 12.70 |
0.1188 times |
Fri 17 October 2025 |
12.27 (-3%) |
12.64 |
11.06 - 12.64 |
0.3201 times |
Thu 16 October 2025 |
12.65 (3.69%) |
12.20 |
10.87 - 12.80 |
1.5216 times |
Wed 15 October 2025 |
12.20 (1.08%) |
12.19 |
12.10 - 12.48 |
0.6973 times |
Tue 14 October 2025 |
12.07 (-11.05%) |
13.57 |
10.90 - 13.96 |
1.7213 times |
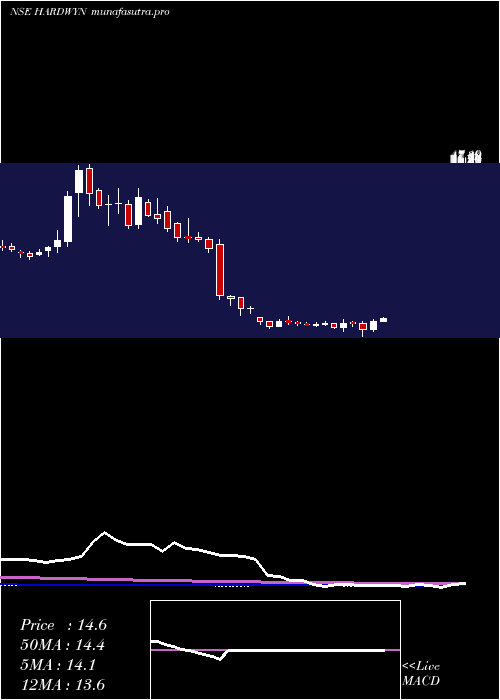
Weekly price and charts HardwynIndia Strong weekly Stock price targets for HardwynIndia HARDWYN are 14.29 and 15.09 | Weekly Target 1 | 13.66 | | Weekly Target 2 | 14.11 | | Weekly Target 3 | 14.456666666667 | | Weekly Target 4 | 14.91 | | Weekly Target 5 | 15.26 |
Weekly price and volumes for Hardwyn India
| Date |
Closing |
Open |
Range |
Volume |
Wed 29 October 2025 |
14.57 (3.63%) |
14.05 |
14.00 - 14.80 |
2.3384 times |
Fri 24 October 2025 |
14.06 (14.59%) |
12.28 |
11.86 - 14.44 |
2.4757 times |
Fri 17 October 2025 |
12.27 (-9.31%) |
13.53 |
10.87 - 14.00 |
2.8118 times |
Fri 10 October 2025 |
13.53 (-1.1%) |
13.88 |
12.99 - 13.90 |
0.5495 times |
Fri 03 October 2025 |
13.68 (8.14%) |
12.65 |
11.90 - 14.40 |
0.6329 times |
Fri 26 September 2025 |
12.65 (-6.43%) |
13.58 |
12.50 - 13.64 |
0.2135 times |
Fri 19 September 2025 |
13.52 (0.97%) |
13.39 |
13.10 - 14.00 |
0.1876 times |
Fri 12 September 2025 |
13.39 (0.83%) |
13.25 |
13.00 - 13.78 |
0.3298 times |
Fri 05 September 2025 |
13.28 (-1.41%) |
13.46 |
13.11 - 13.84 |
0.2511 times |
Fri 29 August 2025 |
13.47 (-3.23%) |
13.86 |
13.10 - 13.98 |
0.2097 times |
Fri 22 August 2025 |
13.92 (-0.43%) |
14.00 |
13.37 - 15.00 |
0.8852 times |
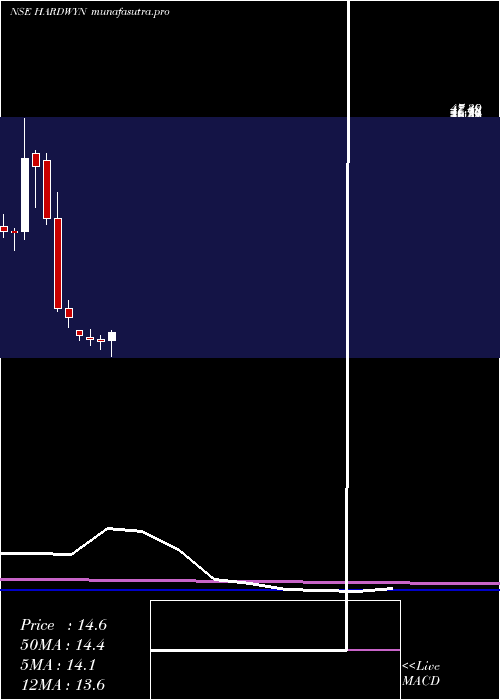
Monthly price and charts HardwynIndia Strong monthly Stock price targets for HardwynIndia HARDWYN are 12.72 and 16.65 | Monthly Target 1 | 9.48 | | Monthly Target 2 | 12.03 | | Monthly Target 3 | 13.413333333333 | | Monthly Target 4 | 15.96 | | Monthly Target 5 | 17.34 |
Monthly price and volumes Hardwyn India
| Date |
Closing |
Open |
Range |
Volume |
Wed 29 October 2025 |
14.57 (11.14%) |
13.28 |
10.87 - 14.80 |
1.3073 times |
Tue 30 September 2025 |
13.11 (-2.67%) |
13.46 |
11.90 - 14.00 |
0.2003 times |
Fri 29 August 2025 |
13.47 (-3.65%) |
13.81 |
12.52 - 15.00 |
0.4381 times |
Thu 31 July 2025 |
13.98 (-16.74%) |
14.89 |
13.34 - 14.89 |
0.2179 times |
Tue 14 January 2025 |
16.79 (-7.9%) |
18.20 |
15.26 - 19.50 |
0.7802 times |
Tue 31 December 2024 |
18.23 (-43.05%) |
32.01 |
17.81 - 36.00 |
2.1896 times |
Fri 29 November 2024 |
32.01 (-19.91%) |
40.90 |
31.15 - 42.00 |
0.9524 times |
Thu 31 October 2024 |
39.97 (-3.2%) |
42.08 |
33.80 - 42.50 |
1.1437 times |
Mon 30 September 2024 |
41.29 (38.28%) |
30.00 |
28.80 - 47.49 |
2.6365 times |
Fri 30 August 2024 |
29.86 (-0.4%) |
29.98 |
27.17 - 30.50 |
0.1341 times |
Wed 31 July 2024 |
29.98 (-2.63%) |
30.79 |
29.16 - 32.59 |
0.29 times |
DMA SMA EMA moving averages of Hardwyn India HARDWYN
DMA (daily moving average) of Hardwyn India HARDWYN
| DMA period | DMA value | | 5 day DMA | 14.1 | | 12 day DMA | 13.17 | | 20 day DMA | 13.28 | | 35 day DMA | 13.26 | | 50 day DMA | 13.38 | | 100 day DMA | 18.13 | | 150 day DMA | 24.88 | | 200 day DMA | 26.15 | EMA (exponential moving average) of Hardwyn India HARDWYN
| EMA period | EMA current | EMA prev | EMA prev2 | | 5 day EMA | 14.08 | 13.84 | 13.51 | | 12 day EMA | 13.56 | 13.38 | 13.18 | | 20 day EMA | 13.41 | 13.29 | 13.16 | | 35 day EMA | 13.38 | 13.31 | 13.24 | | 50 day EMA | 13.47 | 13.43 | 13.39 |
SMA (simple moving average) of Hardwyn India HARDWYN
| SMA period | SMA current | SMA prev | SMA prev2 | | 5 day SMA | 14.1 | 13.68 | 13.25 | | 12 day SMA | 13.17 | 13.09 | 12.99 | | 20 day SMA | 13.28 | 13.16 | 13.07 | | 35 day SMA | 13.26 | 13.23 | 13.2 | | 50 day SMA | 13.38 | 13.36 | 13.35 | | 100 day SMA | 18.13 | 18.32 | 18.52 | | 150 day SMA | 24.88 | 24.99 | 25.09 | | 200 day SMA | 26.15 | 26.23 | 26.31 |
|
|
