GulshanPolyols GULPOLY full analysis,charts,indicators,moving averages,SMA,DMA,EMA,ADX,MACD,RSIGulshan Polyols GULPOLY WideScreen charts, DMA,SMA,EMA technical analysis, forecast prediction, by indicators ADX,MACD,RSI,CCI NSE stock exchange
operates under Commodity Chemicals sector
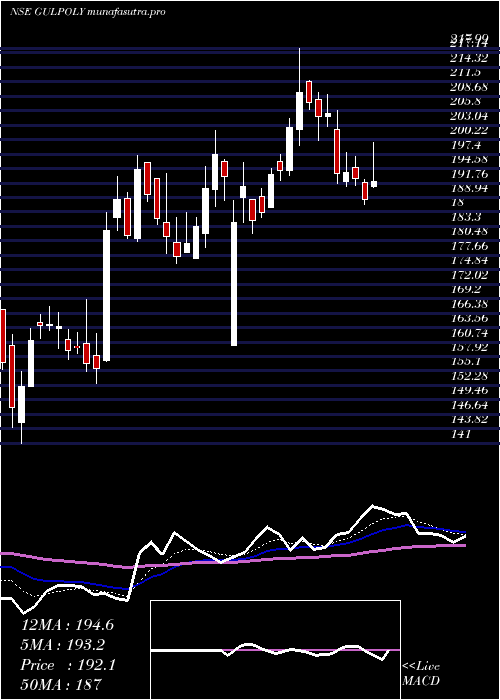
Daily price and charts and targets GulshanPolyols Strong Daily Stock price targets for GulshanPolyols GULPOLY are 150.66 and 153.21 | Daily Target 1 | 150.02 | | Daily Target 2 | 151.29 | | Daily Target 3 | 152.57333333333 | | Daily Target 4 | 153.84 | | Daily Target 5 | 155.12 |
Daily price and volume Gulshan Polyols
| Date |
Closing |
Open |
Range |
Volume |
Tue 28 October 2025 |
152.55 (-0.2%) |
152.86 |
151.31 - 153.86 |
0.1824 times |
Mon 27 October 2025 |
152.86 (-0.17%) |
153.12 |
152.00 - 157.55 |
0.6069 times |
Fri 24 October 2025 |
153.12 (-0.55%) |
153.96 |
150.00 - 154.00 |
0.8571 times |
Thu 23 October 2025 |
153.96 (8.66%) |
164.00 |
152.65 - 164.00 |
7.4576 times |
Tue 21 October 2025 |
141.69 (1.86%) |
140.30 |
139.10 - 145.18 |
0.0786 times |
Mon 20 October 2025 |
139.10 (-0.57%) |
140.20 |
137.05 - 140.39 |
0.1484 times |
Fri 17 October 2025 |
139.90 (-2.12%) |
143.77 |
138.23 - 143.77 |
0.1668 times |
Thu 16 October 2025 |
142.93 (3.24%) |
140.00 |
139.80 - 144.00 |
0.2206 times |
Wed 15 October 2025 |
138.45 (0.16%) |
139.00 |
137.50 - 139.83 |
0.1473 times |
Tue 14 October 2025 |
138.23 (-1.87%) |
141.00 |
137.50 - 141.77 |
0.1342 times |
Mon 13 October 2025 |
140.87 (-3.1%) |
143.05 |
139.90 - 144.31 |
0.3864 times |
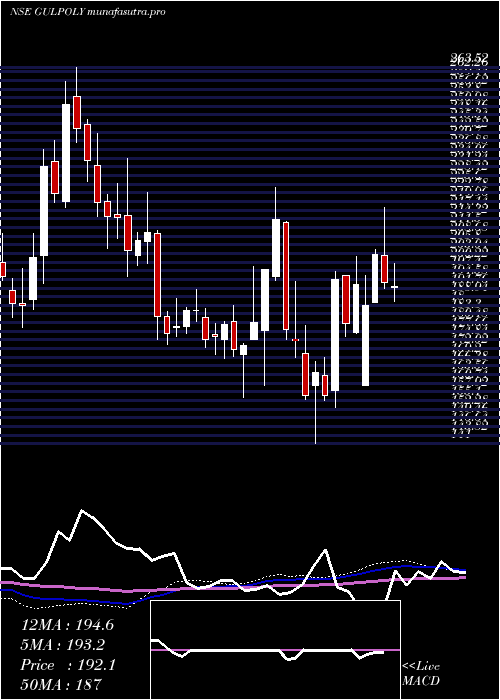
Weekly price and charts GulshanPolyols Strong weekly Stock price targets for GulshanPolyols GULPOLY are 148.81 and 155.05 | Weekly Target 1 | 147.56 | | Weekly Target 2 | 150.06 | | Weekly Target 3 | 153.80333333333 | | Weekly Target 4 | 156.3 | | Weekly Target 5 | 160.04 |
Weekly price and volumes for Gulshan Polyols
| Date |
Closing |
Open |
Range |
Volume |
Tue 28 October 2025 |
152.55 (-0.37%) |
153.12 |
151.31 - 157.55 |
0.4608 times |
Fri 24 October 2025 |
153.12 (9.45%) |
140.20 |
137.05 - 164.00 |
4.9865 times |
Fri 17 October 2025 |
139.90 (-3.76%) |
143.05 |
137.50 - 144.31 |
0.6161 times |
Fri 10 October 2025 |
145.37 (-2.5%) |
149.10 |
142.25 - 149.38 |
0.4017 times |
Fri 03 October 2025 |
149.10 (0.65%) |
150.40 |
145.00 - 155.00 |
0.4868 times |
Fri 26 September 2025 |
148.13 (-6.21%) |
158.90 |
145.45 - 159.50 |
0.5804 times |
Fri 19 September 2025 |
157.93 (-2.23%) |
161.00 |
155.80 - 163.29 |
1.0067 times |
Fri 12 September 2025 |
161.54 (0.54%) |
161.75 |
160.00 - 164.05 |
0.422 times |
Fri 05 September 2025 |
160.68 (-2.15%) |
162.30 |
160.00 - 167.74 |
0.7294 times |
Fri 29 August 2025 |
164.21 (-1.3%) |
166.05 |
161.00 - 170.48 |
0.3096 times |
Fri 22 August 2025 |
166.38 (-0.02%) |
166.99 |
165.01 - 170.35 |
0.5743 times |
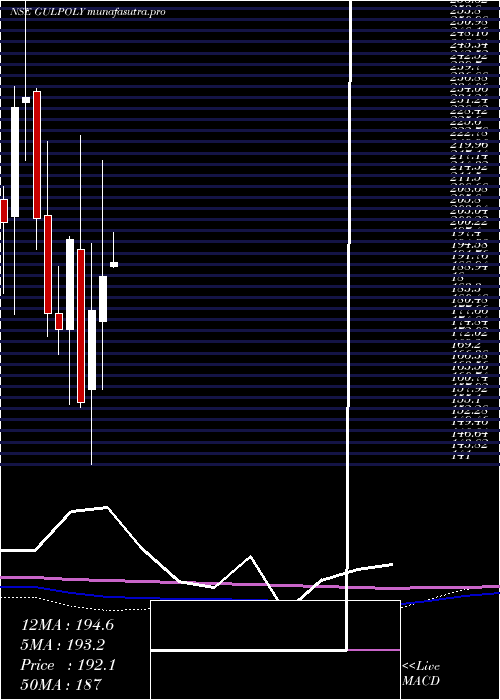
Monthly price and charts GulshanPolyols Strong monthly Stock price targets for GulshanPolyols GULPOLY are 144.8 and 171.75 | Monthly Target 1 | 124.25 | | Monthly Target 2 | 138.4 | | Monthly Target 3 | 151.2 | | Monthly Target 4 | 165.35 | | Monthly Target 5 | 178.15 |
Monthly price and volumes Gulshan Polyols
| Date |
Closing |
Open |
Range |
Volume |
Tue 28 October 2025 |
152.55 (3.19%) |
150.00 |
137.05 - 164.00 |
0.9075 times |
Tue 30 September 2025 |
147.83 (-9.98%) |
162.30 |
145.45 - 167.74 |
0.3959 times |
Fri 29 August 2025 |
164.21 (-3.12%) |
169.40 |
161.00 - 188.00 |
0.4538 times |
Thu 31 July 2025 |
169.49 (-5.71%) |
180.80 |
164.16 - 181.24 |
0.5749 times |
Mon 30 June 2025 |
179.76 (-2.86%) |
184.50 |
174.50 - 191.65 |
0.5511 times |
Fri 30 May 2025 |
185.06 (-1.86%) |
191.10 |
180.10 - 220.50 |
1.0902 times |
Wed 30 April 2025 |
188.56 (4.73%) |
177.11 |
160.00 - 217.99 |
0.8845 times |
Fri 28 March 2025 |
180.05 (14.91%) |
160.00 |
141.00 - 197.10 |
1.7148 times |
Fri 28 February 2025 |
156.69 (-20.83%) |
195.51 |
155.39 - 224.47 |
1.3858 times |
Fri 31 January 2025 |
197.91 (13.05%) |
175.08 |
156.20 - 198.90 |
2.0416 times |
Tue 31 December 2024 |
175.07 (-2.33%) |
179.25 |
168.85 - 191.22 |
0.7095 times |
DMA SMA EMA moving averages of Gulshan Polyols GULPOLY
DMA (daily moving average) of Gulshan Polyols GULPOLY
| DMA period | DMA value | | 5 day DMA | 150.84 | | 12 day DMA | 144.92 | | 20 day DMA | 145.63 | | 35 day DMA | 150.92 | | 50 day DMA | 155.07 | | 100 day DMA | 164.87 | | 150 day DMA | 174.26 | | 200 day DMA | 174.9 | EMA (exponential moving average) of Gulshan Polyols GULPOLY
| EMA period | EMA current | EMA prev | EMA prev2 | | 5 day EMA | 150.52 | 149.51 | 147.83 | | 12 day EMA | 147.75 | 146.88 | 145.79 | | 20 day EMA | 148.1 | 147.63 | 147.08 | | 35 day EMA | 151.26 | 151.18 | 151.08 | | 50 day EMA | 155.86 | 156 | 156.13 |
SMA (simple moving average) of Gulshan Polyols GULPOLY
| SMA period | SMA current | SMA prev | SMA prev2 | | 5 day SMA | 150.84 | 148.15 | 145.55 | | 12 day SMA | 144.92 | 144.16 | 143.47 | | 20 day SMA | 145.63 | 145.41 | 145.38 | | 35 day SMA | 150.92 | 151.15 | 151.4 | | 50 day SMA | 155.07 | 155.31 | 155.6 | | 100 day SMA | 164.87 | 165.19 | 165.52 | | 150 day SMA | 174.26 | 174.5 | 174.7 | | 200 day SMA | 174.9 | 175.01 | 175.15 |
|
|
