GulfOil GULFOILLUB full analysis,charts,indicators,moving averages,SMA,DMA,EMA,ADX,MACD,RSIGulf Oil GULFOILLUB WideScreen charts, DMA,SMA,EMA technical analysis, forecast prediction, by indicators ADX,MACD,RSI,CCI NSE stock exchange
operates under Oil Marketing & Distribution sector
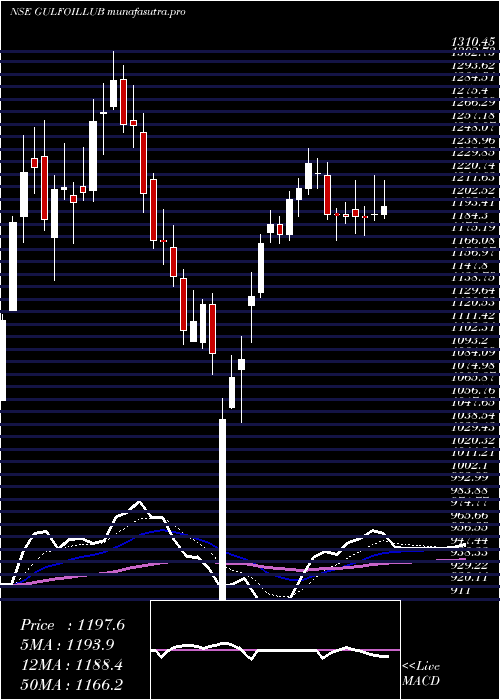
Daily price and charts and targets GulfOil Strong Daily Stock price targets for GulfOil GULFOILLUB are 1215.4 and 1229.4 | Daily Target 1 | 1208.8 | | Daily Target 2 | 1215.6 | | Daily Target 3 | 1222.8 | | Daily Target 4 | 1229.6 | | Daily Target 5 | 1236.8 |
Daily price and volume Gulf Oil
| Date |
Closing |
Open |
Range |
Volume |
Tue 28 October 2025 |
1222.40 (0%) |
1222.40 |
1216.00 - 1230.00 |
0.7239 times |
Mon 27 October 2025 |
1222.40 (0.05%) |
1222.80 |
1210.80 - 1228.40 |
0.963 times |
Fri 24 October 2025 |
1221.80 (1.03%) |
1215.00 |
1206.00 - 1245.00 |
1.4365 times |
Thu 23 October 2025 |
1209.40 (-0.35%) |
1215.00 |
1205.10 - 1243.90 |
2.0372 times |
Tue 21 October 2025 |
1213.70 (0.65%) |
1218.00 |
1203.20 - 1235.00 |
0.3425 times |
Mon 20 October 2025 |
1205.90 (-0.9%) |
1216.80 |
1194.90 - 1218.30 |
1.1043 times |
Fri 17 October 2025 |
1216.80 (-0.82%) |
1229.90 |
1211.00 - 1229.90 |
0.4301 times |
Thu 16 October 2025 |
1226.90 (0.69%) |
1218.50 |
1218.00 - 1234.80 |
0.9576 times |
Wed 15 October 2025 |
1218.50 (0.32%) |
1214.60 |
1210.00 - 1230.90 |
0.8042 times |
Tue 14 October 2025 |
1214.60 (-0.57%) |
1212.10 |
1207.60 - 1229.90 |
1.2007 times |
Mon 13 October 2025 |
1221.60 (1.64%) |
1201.90 |
1197.40 - 1229.80 |
1.3759 times |
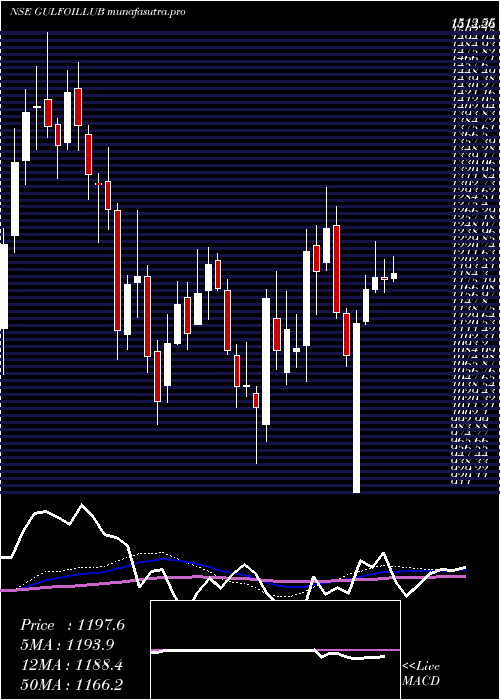
Weekly price and charts GulfOil Strong weekly Stock price targets for GulfOil GULFOILLUB are 1207 and 1226.2 | Weekly Target 1 | 1201.87 | | Weekly Target 2 | 1212.13 | | Weekly Target 3 | 1221.0666666667 | | Weekly Target 4 | 1231.33 | | Weekly Target 5 | 1240.27 |
Weekly price and volumes for Gulf Oil
| Date |
Closing |
Open |
Range |
Volume |
Tue 28 October 2025 |
1222.40 (0.05%) |
1222.80 |
1210.80 - 1230.00 |
0.1729 times |
Fri 24 October 2025 |
1221.80 (0.41%) |
1216.80 |
1194.90 - 1245.00 |
0.5043 times |
Fri 17 October 2025 |
1216.80 (1.24%) |
1201.90 |
1197.40 - 1234.80 |
0.4887 times |
Fri 10 October 2025 |
1201.90 (-1.97%) |
1226.00 |
1198.80 - 1240.70 |
0.9326 times |
Fri 03 October 2025 |
1226.00 (0.86%) |
1215.50 |
1190.20 - 1245.00 |
0.6831 times |
Fri 26 September 2025 |
1215.50 (-4.67%) |
1275.00 |
1205.00 - 1275.00 |
1.0118 times |
Fri 19 September 2025 |
1275.10 (-1.98%) |
1309.60 |
1250.10 - 1329.00 |
2.0957 times |
Fri 12 September 2025 |
1300.80 (3.86%) |
1260.40 |
1246.80 - 1324.60 |
1.5326 times |
Fri 05 September 2025 |
1252.40 (0.22%) |
1255.00 |
1247.70 - 1295.00 |
1.8462 times |
Fri 29 August 2025 |
1249.60 (0.61%) |
1242.30 |
1225.00 - 1270.90 |
0.7322 times |
Fri 22 August 2025 |
1242.00 (7%) |
1163.90 |
1160.00 - 1260.10 |
0.9344 times |
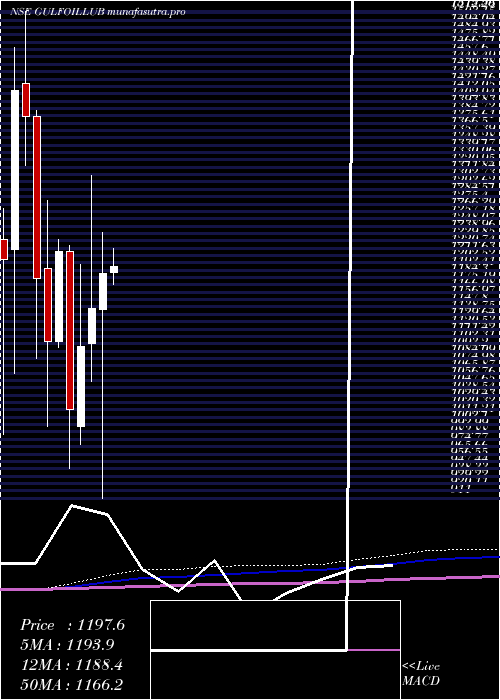
Monthly price and charts GulfOil Strong monthly Stock price targets for GulfOil GULFOILLUB are 1208.65 and 1258.75 | Monthly Target 1 | 1170.67 | | Monthly Target 2 | 1196.53 | | Monthly Target 3 | 1220.7666666667 | | Monthly Target 4 | 1246.63 | | Monthly Target 5 | 1270.87 |
Monthly price and volumes Gulf Oil
| Date |
Closing |
Open |
Range |
Volume |
Tue 28 October 2025 |
1222.40 (1.01%) |
1211.00 |
1194.90 - 1245.00 |
0.3297 times |
Tue 30 September 2025 |
1210.20 (-3.15%) |
1255.00 |
1190.20 - 1329.00 |
0.9155 times |
Fri 29 August 2025 |
1249.60 (3.38%) |
1207.60 |
1143.60 - 1270.90 |
0.5177 times |
Thu 31 July 2025 |
1208.80 (-4.26%) |
1294.70 |
1175.20 - 1331.90 |
1.0472 times |
Mon 30 June 2025 |
1262.60 (6.44%) |
1188.00 |
1145.00 - 1270.00 |
1.1674 times |
Fri 30 May 2025 |
1186.20 (-0.31%) |
1190.10 |
1138.00 - 1265.00 |
1.4107 times |
Wed 30 April 2025 |
1189.90 (3.82%) |
1145.00 |
911.00 - 1239.80 |
0.8391 times |
Fri 28 March 2025 |
1146.15 (4.34%) |
1103.00 |
1055.55 - 1310.45 |
1.4741 times |
Fri 28 February 2025 |
1098.45 (7.56%) |
1000.00 |
977.50 - 1200.00 |
1.4836 times |
Fri 31 January 2025 |
1021.20 (-16.04%) |
1216.25 |
948.00 - 1223.75 |
0.8151 times |
Tue 31 December 2024 |
1216.25 (10.04%) |
1105.25 |
1097.20 - 1232.00 |
1.587 times |
DMA SMA EMA moving averages of Gulf Oil GULFOILLUB
DMA (daily moving average) of Gulf Oil GULFOILLUB
| DMA period | DMA value | | 5 day DMA | 1217.94 | | 12 day DMA | 1216.33 | | 20 day DMA | 1219.42 | | 35 day DMA | 1242.81 | | 50 day DMA | 1242.26 | | 100 day DMA | 1228.66 | | 150 day DMA | 1213.54 | | 200 day DMA | 1188.02 | EMA (exponential moving average) of Gulf Oil GULFOILLUB
| EMA period | EMA current | EMA prev | EMA prev2 | | 5 day EMA | 1219.45 | 1217.98 | 1215.77 | | 12 day EMA | 1219.47 | 1218.94 | 1218.31 | | 20 day EMA | 1223.13 | 1223.21 | 1223.3 | | 35 day EMA | 1226.99 | 1227.26 | 1227.55 | | 50 day EMA | 1233.83 | 1234.3 | 1234.79 |
SMA (simple moving average) of Gulf Oil GULFOILLUB
| SMA period | SMA current | SMA prev | SMA prev2 | | 5 day SMA | 1217.94 | 1214.64 | 1213.52 | | 12 day SMA | 1216.33 | 1216.23 | 1215.14 | | 20 day SMA | 1219.42 | 1219.08 | 1219.21 | | 35 day SMA | 1242.81 | 1243.67 | 1244.87 | | 50 day SMA | 1242.26 | 1241.31 | 1240.07 | | 100 day SMA | 1228.66 | 1228.1 | 1227.63 | | 150 day SMA | 1213.54 | 1213.83 | 1214.07 | | 200 day SMA | 1188.02 | 1187.57 | 1187.34 |
|
|
