GujRaffia GUJRAFFIA full analysis,charts,indicators,moving averages,SMA,DMA,EMA,ADX,MACD,RSIGuj Raffia GUJRAFFIA WideScreen charts, DMA,SMA,EMA technical analysis, forecast prediction, by indicators ADX,MACD,RSI,CCI NSE stock exchange
operates under Containers & Packaging sector
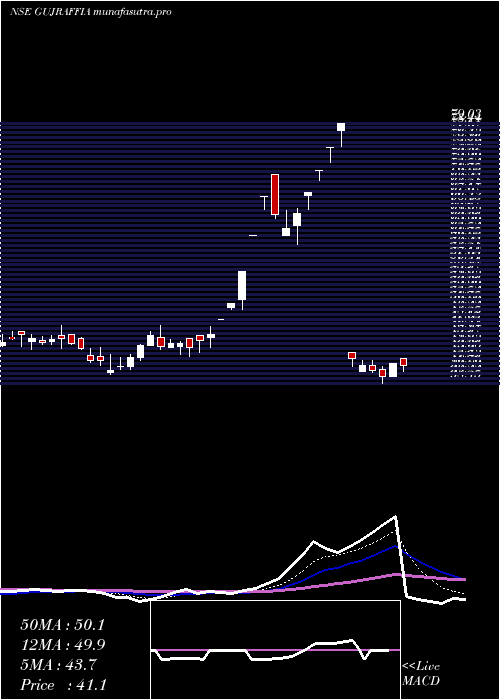
Daily price and charts and targets GujRaffia Strong Daily Stock price targets for GujRaffia GUJRAFFIA are 37.46 and 39.65 | Daily Target 1 | 36.78 | | Daily Target 2 | 38.13 | | Daily Target 3 | 38.966666666667 | | Daily Target 4 | 40.32 | | Daily Target 5 | 41.16 |
Daily price and volume Guj Raffia
| Date |
Closing |
Open |
Range |
Volume |
Wed 03 September 2025 |
39.49 (5.05%) |
39.80 |
37.61 - 39.80 |
0.1935 times |
Tue 02 September 2025 |
37.59 (-1.44%) |
38.41 |
37.22 - 40.00 |
0.1435 times |
Mon 01 September 2025 |
38.14 (-1.88%) |
38.78 |
37.71 - 39.40 |
0.2054 times |
Fri 29 August 2025 |
38.87 (-1.69%) |
39.49 |
38.10 - 39.49 |
0.0893 times |
Thu 28 August 2025 |
39.54 (1.57%) |
39.09 |
38.00 - 40.10 |
0.1882 times |
Tue 26 August 2025 |
38.93 (-2.77%) |
39.99 |
38.23 - 41.40 |
1.9647 times |
Mon 25 August 2025 |
40.04 (2.17%) |
39.64 |
38.02 - 42.49 |
2.3589 times |
Fri 22 August 2025 |
39.19 (-3%) |
40.00 |
38.70 - 40.89 |
0.357 times |
Thu 21 August 2025 |
40.40 (2.67%) |
39.97 |
38.46 - 41.40 |
2.3848 times |
Wed 20 August 2025 |
39.35 (2.31%) |
38.90 |
35.45 - 41.89 |
2.1148 times |
Tue 19 August 2025 |
38.46 (3.67%) |
37.97 |
37.01 - 38.88 |
0.0908 times |
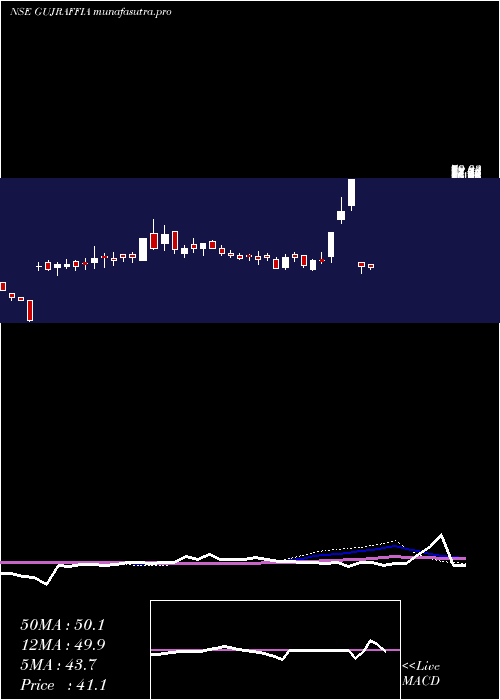
Weekly price and charts GujRaffia Strong weekly Stock price targets for GujRaffia GUJRAFFIA are 38.36 and 41.14 | Weekly Target 1 | 36.12 | | Weekly Target 2 | 37.81 | | Weekly Target 3 | 38.903333333333 | | Weekly Target 4 | 40.59 | | Weekly Target 5 | 41.68 |
Weekly price and volumes for Guj Raffia
| Date |
Closing |
Open |
Range |
Volume |
Wed 03 September 2025 |
39.49 (1.6%) |
38.78 |
37.22 - 40.00 |
0.2145 times |
Fri 29 August 2025 |
38.87 (-0.82%) |
39.64 |
38.00 - 42.49 |
1.8194 times |
Fri 22 August 2025 |
39.19 (6.9%) |
38.00 |
35.45 - 41.89 |
2.0096 times |
Thu 14 August 2025 |
36.66 (-5.76%) |
42.75 |
36.00 - 42.75 |
0.2561 times |
Fri 08 August 2025 |
38.90 (0.49%) |
38.90 |
36.93 - 39.99 |
0.2661 times |
Fri 01 August 2025 |
38.71 (-1.58%) |
37.55 |
36.60 - 40.89 |
0.2688 times |
Fri 25 July 2025 |
39.33 (-2.46%) |
41.62 |
37.29 - 41.62 |
0.79 times |
Fri 18 July 2025 |
40.32 (-2.68%) |
42.25 |
39.16 - 42.25 |
0.4626 times |
Fri 11 July 2025 |
41.43 (-47.58%) |
43.25 |
38.45 - 43.26 |
0.6203 times |
Thu 19 December 2024 |
79.03 (21.53%) |
67.70 |
65.50 - 79.03 |
3.2928 times |
Fri 13 December 2024 |
65.03 (16.33%) |
61.49 |
60.12 - 71.01 |
6.2743 times |
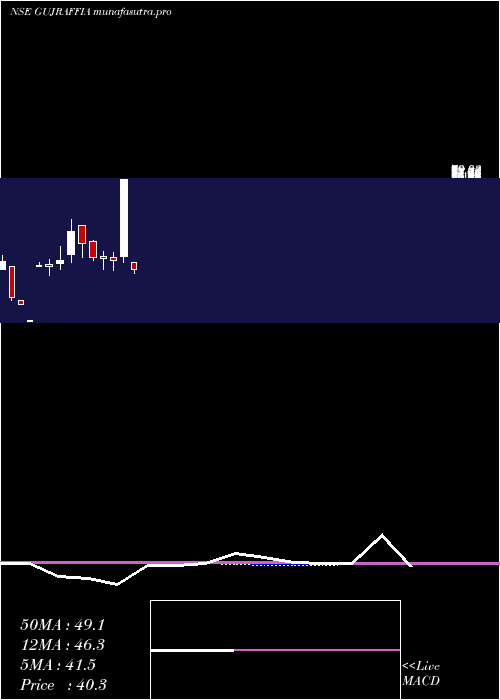
Monthly price and charts GujRaffia Strong monthly Stock price targets for GujRaffia GUJRAFFIA are 38.36 and 41.14 | Monthly Target 1 | 36.12 | | Monthly Target 2 | 37.81 | | Monthly Target 3 | 38.903333333333 | | Monthly Target 4 | 40.59 | | Monthly Target 5 | 41.68 |
Monthly price and volumes Guj Raffia
| Date |
Closing |
Open |
Range |
Volume |
Wed 03 September 2025 |
39.49 (1.6%) |
38.78 |
37.22 - 40.00 |
0.0367 times |
Fri 29 August 2025 |
38.87 (-0.84%) |
39.20 |
35.45 - 42.75 |
0.7508 times |
Thu 31 July 2025 |
39.20 (-50.4%) |
43.25 |
36.60 - 43.26 |
0.3597 times |
Thu 19 December 2024 |
79.03 (79.86%) |
45.94 |
43.21 - 79.03 |
1.9293 times |
Fri 29 November 2024 |
43.94 (-1.79%) |
45.50 |
39.82 - 47.45 |
0.2183 times |
Thu 31 October 2024 |
44.74 (-1.58%) |
45.76 |
40.27 - 47.75 |
0.2784 times |
Mon 30 September 2024 |
45.46 (-11.52%) |
52.40 |
44.21 - 52.79 |
0.3785 times |
Fri 30 August 2024 |
51.38 (-8.84%) |
58.97 |
45.31 - 58.97 |
1.3972 times |
Wed 31 July 2024 |
56.36 (27.48%) |
46.69 |
43.31 - 61.76 |
3.5408 times |
Fri 28 June 2024 |
44.21 (6.92%) |
42.95 |
40.35 - 50.00 |
1.1104 times |
Fri 31 May 2024 |
41.35 (-1.08%) |
42.15 |
37.55 - 44.30 |
0.681 times |
DMA SMA EMA moving averages of Guj Raffia GUJRAFFIA
DMA (daily moving average) of Guj Raffia GUJRAFFIA
| DMA period | DMA value | | 5 day DMA | 38.73 | | 12 day DMA | 38.93 | | 20 day DMA | 38.52 | | 35 day DMA | 38.89 | | 50 day DMA | 44.46 | | 100 day DMA | 44.61 | | 150 day DMA | 46.33 | | 200 day DMA | 45.58 | EMA (exponential moving average) of Guj Raffia GUJRAFFIA
| EMA period | EMA current | EMA prev | EMA prev2 | | 5 day EMA | 38.78 | 38.42 | 38.83 | | 12 day EMA | 38.8 | 38.68 | 38.88 | | 20 day EMA | 39.26 | 39.24 | 39.41 | | 35 day EMA | 41.78 | 41.92 | 42.18 | | 50 day EMA | 44.28 | 44.48 | 44.76 |
SMA (simple moving average) of Guj Raffia GUJRAFFIA
| SMA period | SMA current | SMA prev | SMA prev2 | | 5 day SMA | 38.73 | 38.61 | 39.1 | | 12 day SMA | 38.93 | 38.69 | 38.79 | | 20 day SMA | 38.52 | 38.47 | 38.52 | | 35 day SMA | 38.89 | 38.93 | 39.04 | | 50 day SMA | 44.46 | 44.78 | 45.05 | | 100 day SMA | 44.61 | 44.68 | 44.76 | | 150 day SMA | 46.33 | 46.37 | 46.42 | | 200 day SMA | 45.58 | 45.58 | 45.6 |
|
|
