GujaratGas GUJGASLTD full analysis,charts,indicators,moving averages,SMA,DMA,EMA,ADX,MACD,RSIGujarat Gas GUJGASLTD WideScreen charts, DMA,SMA,EMA technical analysis, forecast prediction, by indicators ADX,MACD,RSI,CCI NSE stock exchange
Daily price and charts and targets GujaratGas Strong Daily Stock price targets for GujaratGas GUJGASLTD are 407.48 and 418.78 | Daily Target 1 | 398.83 | | Daily Target 2 | 404.82 | | Daily Target 3 | 410.13333333333 | | Daily Target 4 | 416.12 | | Daily Target 5 | 421.43 |
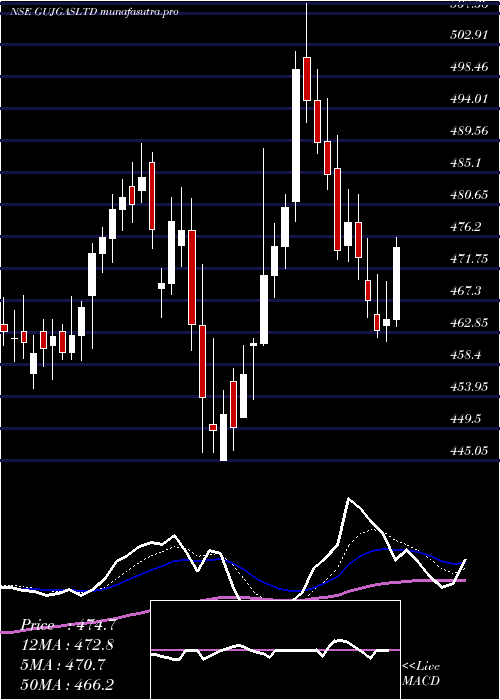
Daily price and volume Gujarat Gas
| Date |
Closing |
Open |
Range |
Volume |
Wed 29 October 2025 |
410.80 (1.23%) |
406.70 |
404.15 - 415.45 |
3.155 times |
Tue 28 October 2025 |
405.80 (-1.65%) |
412.60 |
405.25 - 414.90 |
0.7036 times |
Mon 27 October 2025 |
412.60 (-0.78%) |
415.85 |
411.70 - 417.00 |
0.393 times |
Fri 24 October 2025 |
415.85 (0.46%) |
413.95 |
412.50 - 417.00 |
1.2968 times |
Thu 23 October 2025 |
413.95 (-0.81%) |
418.00 |
413.05 - 419.30 |
0.7135 times |
Tue 21 October 2025 |
417.35 (1.1%) |
417.20 |
415.05 - 419.00 |
0.0669 times |
Mon 20 October 2025 |
412.80 (-1.78%) |
421.95 |
412.05 - 423.80 |
0.7207 times |
Fri 17 October 2025 |
420.30 (0.1%) |
419.90 |
418.05 - 421.75 |
0.5352 times |
Thu 16 October 2025 |
419.90 (-1.44%) |
425.90 |
419.15 - 429.15 |
0.9294 times |
Wed 15 October 2025 |
426.05 (-0.07%) |
427.15 |
420.35 - 432.00 |
1.486 times |
Tue 14 October 2025 |
426.35 (-0.12%) |
426.85 |
425.00 - 436.80 |
0.6255 times |
Weekly price and charts GujaratGas Strong weekly Stock price targets for GujaratGas GUJGASLTD are 401.05 and 413.9 | Weekly Target 1 | 397.8 | | Weekly Target 2 | 404.3 | | Weekly Target 3 | 410.65 | | Weekly Target 4 | 417.15 | | Weekly Target 5 | 423.5 |
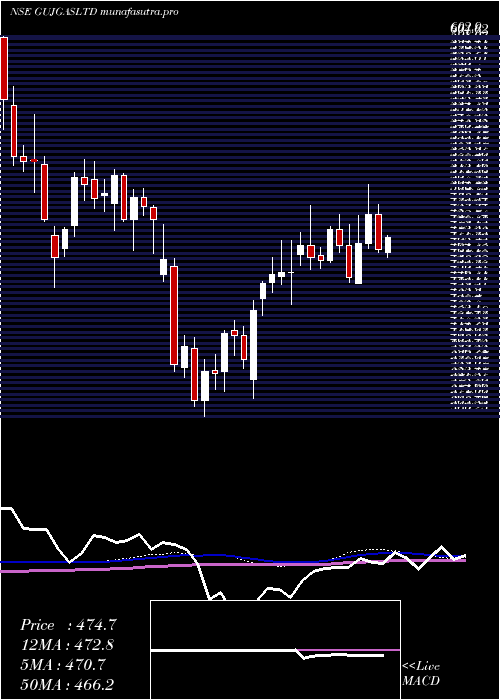
Weekly price and volumes for Gujarat Gas
| Date |
Closing |
Open |
Range |
Volume |
Wed 29 October 2025 |
410.80 (-1.21%) |
415.85 |
404.15 - 417.00 |
1.0781 times |
Fri 24 October 2025 |
415.85 (-1.06%) |
421.95 |
412.05 - 423.80 |
0.7095 times |
Fri 17 October 2025 |
420.30 (-2.18%) |
428.00 |
418.05 - 436.80 |
1.201 times |
Fri 10 October 2025 |
429.65 (-1.6%) |
439.50 |
426.00 - 439.50 |
0.9606 times |
Fri 03 October 2025 |
436.65 (2.97%) |
424.10 |
419.65 - 437.80 |
0.8943 times |
Fri 26 September 2025 |
424.05 (-2.51%) |
435.00 |
423.20 - 440.95 |
0.9682 times |
Fri 19 September 2025 |
434.95 (0.9%) |
432.05 |
429.50 - 447.45 |
0.8304 times |
Fri 12 September 2025 |
431.05 (-0.67%) |
433.00 |
427.55 - 452.00 |
1.2909 times |
Fri 05 September 2025 |
433.95 (3.46%) |
422.00 |
419.05 - 450.35 |
1.1172 times |
Fri 29 August 2025 |
419.45 (-2.92%) |
433.30 |
416.25 - 435.90 |
0.9498 times |
Fri 22 August 2025 |
432.05 (2.32%) |
426.20 |
422.65 - 439.20 |
0.4619 times |
Monthly price and charts GujaratGas Strong monthly Stock price targets for GujaratGas GUJGASLTD are 389.8 and 425.15 | Monthly Target 1 | 382.8 | | Monthly Target 2 | 396.8 | | Monthly Target 3 | 418.15 | | Monthly Target 4 | 432.15 | | Monthly Target 5 | 453.5 |
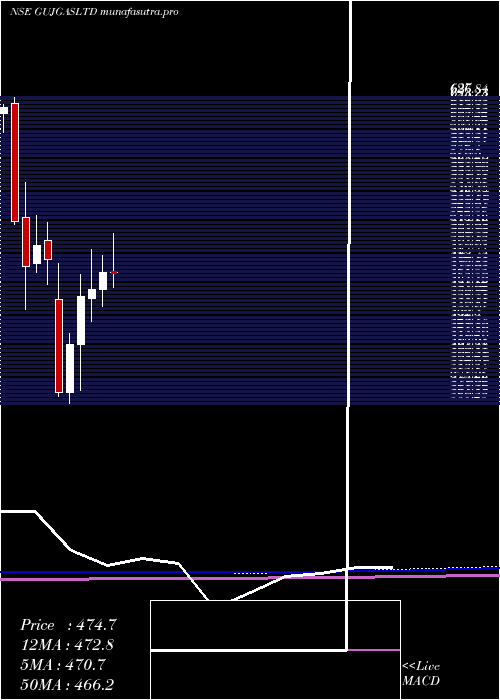
Monthly price and volumes Gujarat Gas
| Date |
Closing |
Open |
Range |
Volume |
Wed 29 October 2025 |
410.80 (-4.37%) |
426.40 |
404.15 - 439.50 |
0.6062 times |
Tue 30 September 2025 |
429.55 (2.41%) |
422.00 |
419.05 - 452.00 |
0.6749 times |
Fri 29 August 2025 |
419.45 (-4.78%) |
445.00 |
416.25 - 452.35 |
0.4718 times |
Thu 31 July 2025 |
440.50 (-7.22%) |
474.80 |
438.30 - 508.70 |
0.8004 times |
Mon 30 June 2025 |
474.80 (3.21%) |
460.05 |
445.05 - 489.20 |
0.9588 times |
Fri 30 May 2025 |
460.05 (1.44%) |
452.00 |
432.00 - 495.00 |
1.1216 times |
Wed 30 April 2025 |
453.50 (9.98%) |
412.00 |
371.95 - 473.00 |
0.7549 times |
Fri 28 March 2025 |
412.35 (11.34%) |
370.35 |
360.25 - 421.80 |
1.2797 times |
Fri 28 February 2025 |
370.35 (-23.8%) |
451.30 |
367.00 - 482.75 |
1.9363 times |
Fri 31 January 2025 |
486.00 (-2.55%) |
502.25 |
464.40 - 517.90 |
1.3954 times |
Tue 31 December 2024 |
498.70 (3.95%) |
482.40 |
475.10 - 524.25 |
1.5151 times |
DMA SMA EMA moving averages of Gujarat Gas GUJGASLTD
DMA (daily moving average) of Gujarat Gas GUJGASLTD
| DMA period | DMA value | | 5 day DMA | 411.8 | | 12 day DMA | 417.38 | | 20 day DMA | 422.99 | | 35 day DMA | 427.47 | | 50 day DMA | 428.94 | | 100 day DMA | 445.01 | | 150 day DMA | 444.98 | | 200 day DMA | 442.48 | EMA (exponential moving average) of Gujarat Gas GUJGASLTD
| EMA period | EMA current | EMA prev | EMA prev2 | | 5 day EMA | 411.75 | 412.22 | 415.43 | | 12 day EMA | 416.52 | 417.56 | 419.7 | | 20 day EMA | 420.26 | 421.25 | 422.88 | | 35 day EMA | 424 | 424.78 | 425.9 | | 50 day EMA | 427 | 427.66 | 428.55 |
SMA (simple moving average) of Gujarat Gas GUJGASLTD
| SMA period | SMA current | SMA prev | SMA prev2 | | 5 day SMA | 411.8 | 413.11 | 414.51 | | 12 day SMA | 417.38 | 418.95 | 420.81 | | 20 day SMA | 422.99 | 423.72 | 424.63 | | 35 day SMA | 427.47 | 428.03 | 428.84 | | 50 day SMA | 428.94 | 429.17 | 429.53 | | 100 day SMA | 445.01 | 445.66 | 446.35 | | 150 day SMA | 444.98 | 444.93 | 444.85 | | 200 day SMA | 442.48 | 442.97 | 443.48 |
|
|
