GtplHathway GTPL full analysis,charts,indicators,moving averages,SMA,DMA,EMA,ADX,MACD,RSIGtpl Hathway GTPL WideScreen charts, DMA,SMA,EMA technical analysis, forecast prediction, by indicators ADX,MACD,RSI,CCI NSE stock exchange
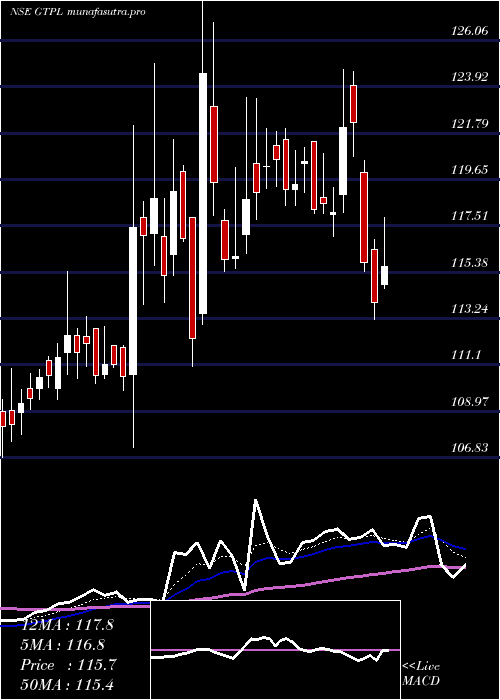
Daily price and charts and targets GtplHathway Strong Daily Stock price targets for GtplHathway GTPL are 105.67 and 107.19 | Daily Target 1 | 104.52 | | Daily Target 2 | 105.3 | | Daily Target 3 | 106.03666666667 | | Daily Target 4 | 106.82 | | Daily Target 5 | 107.56 |
Daily price and volume Gtpl Hathway
| Date |
Closing |
Open |
Range |
Volume |
Tue 28 October 2025 |
106.09 (0.86%) |
105.68 |
105.25 - 106.77 |
0.3659 times |
Mon 27 October 2025 |
105.19 (-0.64%) |
106.70 |
104.90 - 107.09 |
0.6536 times |
Fri 24 October 2025 |
105.87 (-0.46%) |
107.10 |
105.12 - 108.96 |
0.477 times |
Thu 23 October 2025 |
106.36 (-0.06%) |
107.30 |
106.00 - 107.30 |
0.3264 times |
Tue 21 October 2025 |
106.42 (1.6%) |
104.31 |
104.31 - 107.00 |
0.1235 times |
Mon 20 October 2025 |
104.74 (-0.28%) |
105.00 |
104.30 - 106.00 |
0.7478 times |
Fri 17 October 2025 |
105.03 (-1.11%) |
106.74 |
104.85 - 106.74 |
0.6286 times |
Thu 16 October 2025 |
106.21 (-0.23%) |
107.00 |
105.80 - 107.55 |
0.5444 times |
Wed 15 October 2025 |
106.45 (-2.49%) |
110.75 |
105.80 - 111.01 |
2.1792 times |
Tue 14 October 2025 |
109.17 (0.85%) |
107.90 |
107.00 - 118.25 |
3.9535 times |
Mon 13 October 2025 |
108.25 (2.24%) |
105.88 |
105.55 - 111.68 |
1.5343 times |
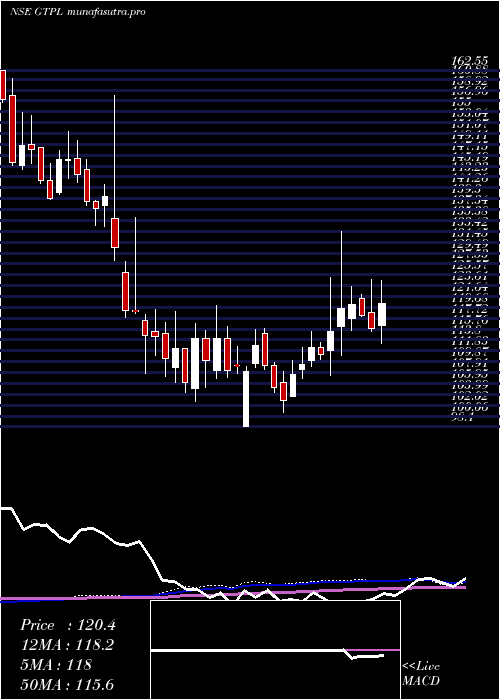
Weekly price and charts GtplHathway Strong weekly Stock price targets for GtplHathway GTPL are 104.4 and 106.59 | Weekly Target 1 | 103.84 | | Weekly Target 2 | 104.96 | | Weekly Target 3 | 106.02666666667 | | Weekly Target 4 | 107.15 | | Weekly Target 5 | 108.22 |
Weekly price and volumes for Gtpl Hathway
| Date |
Closing |
Open |
Range |
Volume |
Tue 28 October 2025 |
106.09 (0.21%) |
106.70 |
104.90 - 107.09 |
0.3369 times |
Fri 24 October 2025 |
105.87 (0.8%) |
105.00 |
104.30 - 108.96 |
0.5534 times |
Fri 17 October 2025 |
105.03 (-0.8%) |
105.88 |
104.85 - 118.25 |
2.9209 times |
Fri 10 October 2025 |
105.88 (-2.3%) |
108.37 |
105.55 - 108.38 |
0.9745 times |
Fri 03 October 2025 |
108.37 (-1.37%) |
110.00 |
107.50 - 111.50 |
0.8083 times |
Fri 26 September 2025 |
109.87 (-5.2%) |
115.90 |
108.47 - 116.17 |
1.1659 times |
Fri 19 September 2025 |
115.90 (0.9%) |
116.50 |
114.06 - 118.95 |
1.092 times |
Fri 12 September 2025 |
114.87 (-0.78%) |
116.44 |
114.00 - 117.76 |
0.7077 times |
Fri 05 September 2025 |
115.77 (0.45%) |
116.10 |
114.02 - 118.70 |
0.7263 times |
Fri 29 August 2025 |
115.25 (-1.45%) |
117.80 |
111.90 - 118.02 |
0.7142 times |
Fri 22 August 2025 |
116.95 (0.84%) |
116.30 |
114.40 - 120.38 |
1.2822 times |
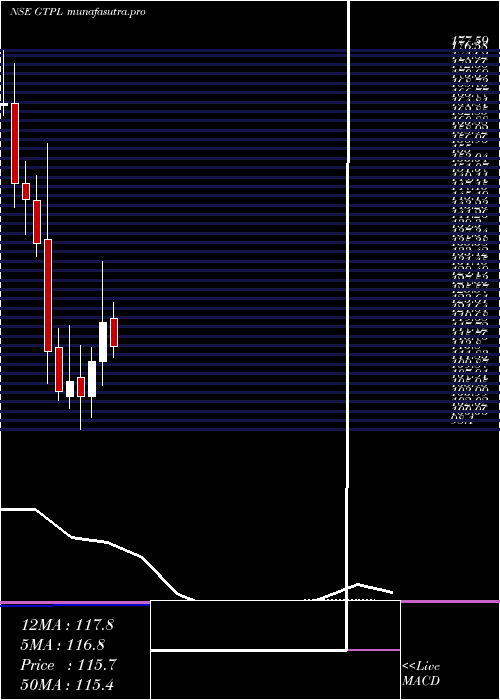
Monthly price and charts GtplHathway Strong monthly Stock price targets for GtplHathway GTPL are 98.22 and 112.17 | Monthly Target 1 | 95.6 | | Monthly Target 2 | 100.84 | | Monthly Target 3 | 109.54666666667 | | Monthly Target 4 | 114.79 | | Monthly Target 5 | 123.5 |
Monthly price and volumes Gtpl Hathway
| Date |
Closing |
Open |
Range |
Volume |
Tue 28 October 2025 |
106.09 (-1.77%) |
108.90 |
104.30 - 118.25 |
0.1797 times |
Tue 30 September 2025 |
108.00 (-6.29%) |
116.10 |
107.85 - 118.95 |
0.1448 times |
Fri 29 August 2025 |
115.25 (-3.7%) |
119.80 |
111.90 - 125.00 |
0.1905 times |
Thu 31 July 2025 |
119.68 (-0.73%) |
121.50 |
113.20 - 127.49 |
1.1595 times |
Mon 30 June 2025 |
120.56 (7.19%) |
112.47 |
107.29 - 133.40 |
3.5405 times |
Fri 30 May 2025 |
112.47 (7.11%) |
105.10 |
100.75 - 115.40 |
0.2971 times |
Wed 30 April 2025 |
105.00 (-3.01%) |
109.15 |
98.10 - 115.80 |
0.3464 times |
Fri 28 March 2025 |
108.26 (2.06%) |
105.00 |
102.65 - 120.00 |
1.8232 times |
Fri 28 February 2025 |
106.08 (-7.39%) |
115.25 |
104.25 - 119.28 |
0.9914 times |
Fri 31 January 2025 |
114.55 (-16.45%) |
138.04 |
107.75 - 157.99 |
1.327 times |
Tue 31 December 2024 |
137.11 (-6.3%) |
146.17 |
134.35 - 151.48 |
0.1602 times |
DMA SMA EMA moving averages of Gtpl Hathway GTPL
DMA (daily moving average) of Gtpl Hathway GTPL
| DMA period | DMA value | | 5 day DMA | 105.99 | | 12 day DMA | 106.31 | | 20 day DMA | 106.8 | | 35 day DMA | 110.23 | | 50 day DMA | 112.04 | | 100 day DMA | 115.08 | | 150 day DMA | 113.08 | | 200 day DMA | 113.67 | EMA (exponential moving average) of Gtpl Hathway GTPL
| EMA period | EMA current | EMA prev | EMA prev2 | | 5 day EMA | 105.87 | 105.76 | 106.04 | | 12 day EMA | 106.42 | 106.48 | 106.72 | | 20 day EMA | 107.5 | 107.65 | 107.91 | | 35 day EMA | 109.48 | 109.68 | 109.94 | | 50 day EMA | 111.87 | 112.11 | 112.39 |
SMA (simple moving average) of Gtpl Hathway GTPL
| SMA period | SMA current | SMA prev | SMA prev2 | | 5 day SMA | 105.99 | 105.72 | 105.68 | | 12 day SMA | 106.31 | 106.29 | 106.4 | | 20 day SMA | 106.8 | 106.99 | 107.39 | | 35 day SMA | 110.23 | 110.51 | 110.82 | | 50 day SMA | 112.04 | 112.25 | 112.49 | | 100 day SMA | 115.08 | 115.12 | 115.19 | | 150 day SMA | 113.08 | 113.11 | 113.14 | | 200 day SMA | 113.67 | 113.82 | 113.99 |
|
|
