GtlInfrastructure GTLINFRA full analysis,charts,indicators,moving averages,SMA,DMA,EMA,ADX,MACD,RSIGtl Infrastructure GTLINFRA WideScreen charts, DMA,SMA,EMA technical analysis, forecast prediction, by indicators ADX,MACD,RSI,CCI NSE stock exchange
operates under Telecom Equipment sector
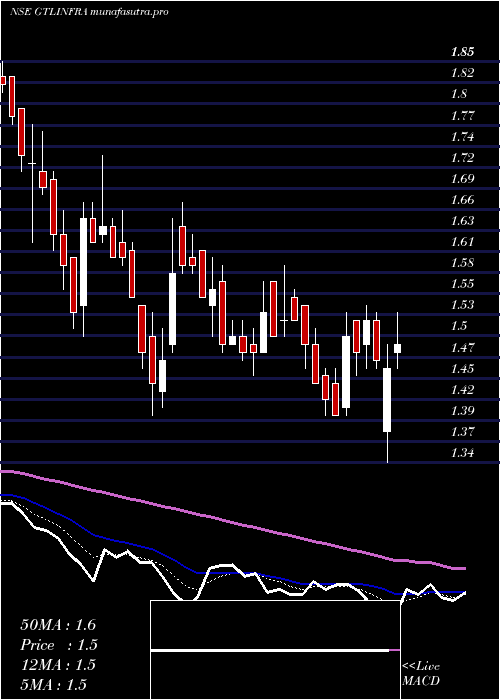
Daily price and charts and targets GtlInfrastructure Strong Daily Stock price targets for GtlInfrastructure GTLINFRA are 1.27 and 1.3 | Daily Target 1 | 1.26 | | Daily Target 2 | 1.28 | | Daily Target 3 | 1.2933333333333 | | Daily Target 4 | 1.31 | | Daily Target 5 | 1.32 |
Daily price and volume Gtl Infrastructure
| Date |
Closing |
Open |
Range |
Volume |
Fri 05 December 2025 |
1.29 (-0.77%) |
1.30 |
1.28 - 1.31 |
0.892 times |
Thu 04 December 2025 |
1.30 (0%) |
1.30 |
1.30 - 1.33 |
0.8892 times |
Wed 03 December 2025 |
1.30 (-1.52%) |
1.32 |
1.30 - 1.33 |
1.1225 times |
Tue 02 December 2025 |
1.32 (0%) |
1.33 |
1.32 - 1.37 |
1.0674 times |
Mon 01 December 2025 |
1.32 (-1.49%) |
1.34 |
1.32 - 1.35 |
0.7768 times |
Fri 28 November 2025 |
1.34 (-1.47%) |
1.36 |
1.34 - 1.37 |
0.511 times |
Thu 27 November 2025 |
1.36 (0.74%) |
1.35 |
1.35 - 1.40 |
0.8482 times |
Wed 26 November 2025 |
1.35 (1.5%) |
1.33 |
1.33 - 1.38 |
1.7429 times |
Tue 25 November 2025 |
1.33 (2.31%) |
1.31 |
1.31 - 1.36 |
1.0816 times |
Mon 24 November 2025 |
1.30 (-2.99%) |
1.34 |
1.30 - 1.35 |
1.0685 times |
Fri 21 November 2025 |
1.34 (-1.47%) |
1.36 |
1.34 - 1.37 |
0.8278 times |
Weekly price and charts GtlInfrastructure Strong weekly Stock price targets for GtlInfrastructure GTLINFRA are 1.24 and 1.33 | Weekly Target 1 | 1.22 | | Weekly Target 2 | 1.26 | | Weekly Target 3 | 1.3133333333333 | | Weekly Target 4 | 1.35 | | Weekly Target 5 | 1.4 |
Weekly price and volumes for Gtl Infrastructure
| Date |
Closing |
Open |
Range |
Volume |
Fri 05 December 2025 |
1.29 (-3.73%) |
1.34 |
1.28 - 1.37 |
1.0433 times |
Fri 28 November 2025 |
1.34 (0%) |
1.34 |
1.30 - 1.40 |
1.1541 times |
Fri 21 November 2025 |
1.34 (-4.29%) |
1.41 |
1.34 - 1.41 |
0.8605 times |
Fri 14 November 2025 |
1.40 (-1.41%) |
1.42 |
1.39 - 1.45 |
1.0088 times |
Fri 07 November 2025 |
1.42 (-2.07%) |
1.45 |
1.39 - 1.46 |
0.7746 times |
Fri 31 October 2025 |
1.45 (-1.36%) |
1.47 |
1.43 - 1.52 |
1.3528 times |
Fri 24 October 2025 |
1.47 (1.38%) |
1.45 |
1.45 - 1.49 |
0.7816 times |
Fri 17 October 2025 |
1.45 (-3.33%) |
1.50 |
1.41 - 1.50 |
0.9602 times |
Fri 10 October 2025 |
1.50 (0%) |
1.51 |
1.47 - 1.52 |
1.203 times |
Fri 03 October 2025 |
1.50 (0%) |
1.50 |
1.49 - 1.53 |
0.8612 times |
Fri 26 September 2025 |
1.50 (-4.46%) |
1.57 |
1.50 - 1.60 |
1.475 times |
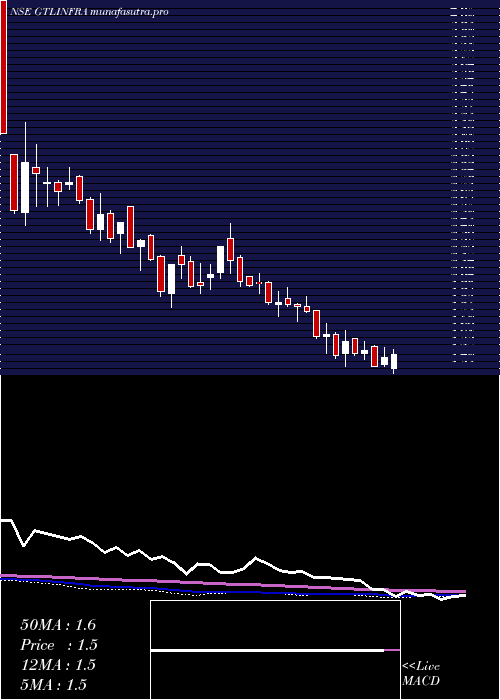
Monthly price and charts GtlInfrastructure Strong monthly Stock price targets for GtlInfrastructure GTLINFRA are 1.24 and 1.33 | Monthly Target 1 | 1.22 | | Monthly Target 2 | 1.26 | | Monthly Target 3 | 1.3133333333333 | | Monthly Target 4 | 1.35 | | Monthly Target 5 | 1.4 |
Monthly price and volumes Gtl Infrastructure
| Date |
Closing |
Open |
Range |
Volume |
Fri 05 December 2025 |
1.29 (-3.73%) |
1.34 |
1.28 - 1.37 |
0.1132 times |
Fri 28 November 2025 |
1.34 (-7.59%) |
1.45 |
1.30 - 1.46 |
0.4122 times |
Fri 31 October 2025 |
1.45 (-3.33%) |
1.51 |
1.41 - 1.53 |
0.5183 times |
Tue 30 September 2025 |
1.50 (1.35%) |
1.48 |
1.47 - 1.66 |
0.9138 times |
Fri 29 August 2025 |
1.48 (-3.9%) |
1.54 |
1.44 - 1.63 |
0.528 times |
Thu 31 July 2025 |
1.54 (-14.92%) |
1.83 |
1.51 - 1.87 |
1.4816 times |
Mon 30 June 2025 |
1.81 (21.48%) |
1.49 |
1.48 - 2.17 |
3.2539 times |
Fri 30 May 2025 |
1.49 (3.47%) |
1.44 |
1.28 - 1.59 |
0.877 times |
Wed 30 April 2025 |
1.44 (2.86%) |
1.41 |
1.34 - 1.77 |
1.0178 times |
Fri 28 March 2025 |
1.40 (-5.41%) |
1.50 |
1.40 - 1.67 |
0.8843 times |
Fri 28 February 2025 |
1.48 (-20.43%) |
1.86 |
1.46 - 1.93 |
0.6742 times |

DMA SMA EMA moving averages of Gtl Infrastructure GTLINFRA
DMA (daily moving average) of Gtl Infrastructure GTLINFRA
| DMA period | DMA value | | 5 day DMA | 1.31 | | 12 day DMA | 1.33 | | 20 day DMA | 1.35 | | 35 day DMA | 1.4 | | 50 day DMA | 1.42 | | 100 day DMA | 1.49 | | 150 day DMA | 1.53 | | 200 day DMA | 1.53 | EMA (exponential moving average) of Gtl Infrastructure GTLINFRA
| EMA period | EMA current | EMA prev | EMA prev2 | | 5 day EMA | 1.3 | 1.31 | 1.32 | | 12 day EMA | 1.32 | 1.33 | 1.34 | | 20 day EMA | 1.34 | 1.35 | 1.36 | | 35 day EMA | 1.37 | 1.38 | 1.39 | | 50 day EMA | 1.41 | 1.42 | 1.43 |
SMA (simple moving average) of Gtl Infrastructure GTLINFRA
| SMA period | SMA current | SMA prev | SMA prev2 | | 5 day SMA | 1.31 | 1.32 | 1.33 | | 12 day SMA | 1.33 | 1.33 | 1.34 | | 20 day SMA | 1.35 | 1.36 | 1.37 | | 35 day SMA | 1.4 | 1.4 | 1.41 | | 50 day SMA | 1.42 | 1.43 | 1.43 | | 100 day SMA | 1.49 | 1.49 | 1.49 | | 150 day SMA | 1.53 | 1.53 | 1.53 | | 200 day SMA | 1.53 | 1.53 | 1.53 |
|
|
