Gtl GTL full analysis,charts,indicators,moving averages,SMA,DMA,EMA,ADX,MACD,RSIGtl GTL WideScreen charts, DMA,SMA,EMA technical analysis, forecast prediction, by indicators ADX,MACD,RSI,CCI NSE stock exchange
operates under Other Telecom Services sector
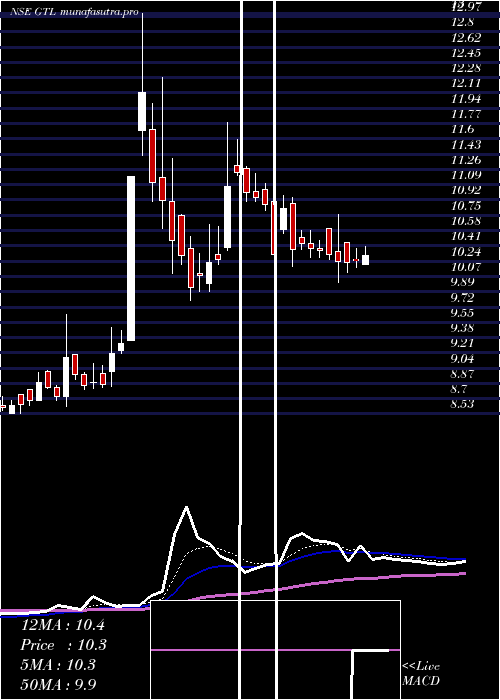
Daily price and charts and targets Gtl Strong Daily Stock price targets for Gtl GTL are 9.14 and 9.25 | Daily Target 1 | 9.12 | | Daily Target 2 | 9.16 | | Daily Target 3 | 9.2266666666667 | | Daily Target 4 | 9.27 | | Daily Target 5 | 9.34 |
Daily price and volume Gtl
| Date |
Closing |
Open |
Range |
Volume |
Tue 28 October 2025 |
9.21 (-0.43%) |
9.29 |
9.18 - 9.29 |
1.1232 times |
Mon 27 October 2025 |
9.25 (0.87%) |
9.12 |
9.12 - 9.29 |
1.1572 times |
Fri 24 October 2025 |
9.17 (-0.11%) |
9.25 |
9.10 - 9.31 |
1.3156 times |
Thu 23 October 2025 |
9.18 (-0.22%) |
9.31 |
9.08 - 9.38 |
1.2983 times |
Tue 21 October 2025 |
9.20 (0.11%) |
9.16 |
9.16 - 9.28 |
0.3713 times |
Mon 20 October 2025 |
9.19 (0.66%) |
9.20 |
9.15 - 9.33 |
0.7776 times |
Fri 17 October 2025 |
9.13 (-0.65%) |
9.24 |
9.11 - 9.38 |
0.8705 times |
Thu 16 October 2025 |
9.19 (0.22%) |
9.17 |
9.16 - 9.38 |
0.7045 times |
Wed 15 October 2025 |
9.17 (-0.22%) |
9.18 |
9.11 - 9.28 |
0.6971 times |
Tue 14 October 2025 |
9.19 (-1.18%) |
9.13 |
9.10 - 9.41 |
1.6846 times |
Mon 13 October 2025 |
9.30 (-0.85%) |
9.55 |
9.10 - 9.55 |
0.9569 times |
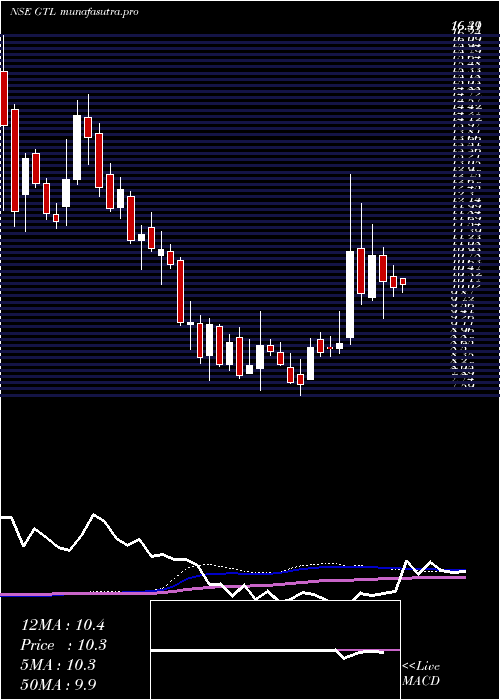
Weekly price and charts Gtl Strong weekly Stock price targets for Gtl GTL are 9.17 and 9.34 | Weekly Target 1 | 9.04 | | Weekly Target 2 | 9.12 | | Weekly Target 3 | 9.2066666666667 | | Weekly Target 4 | 9.29 | | Weekly Target 5 | 9.38 |
Weekly price and volumes for Gtl
| Date |
Closing |
Open |
Range |
Volume |
Tue 28 October 2025 |
9.21 (0.44%) |
9.12 |
9.12 - 9.29 |
0.169 times |
Fri 24 October 2025 |
9.17 (0.44%) |
9.20 |
9.08 - 9.38 |
0.2788 times |
Fri 17 October 2025 |
9.13 (-2.67%) |
9.55 |
9.10 - 9.55 |
0.3641 times |
Fri 10 October 2025 |
9.38 (-2.19%) |
9.59 |
9.30 - 9.69 |
0.3352 times |
Fri 03 October 2025 |
9.59 (3.68%) |
9.25 |
9.20 - 9.80 |
0.4386 times |
Fri 26 September 2025 |
9.25 (-11.57%) |
10.46 |
9.15 - 10.57 |
1.4797 times |
Fri 19 September 2025 |
10.46 (13.82%) |
9.19 |
9.18 - 11.26 |
5.5042 times |
Fri 12 September 2025 |
9.19 (-1.92%) |
9.50 |
9.13 - 9.59 |
0.3366 times |
Fri 05 September 2025 |
9.37 (2.07%) |
9.15 |
8.41 - 9.54 |
0.5076 times |
Fri 29 August 2025 |
9.18 (-9.2%) |
10.24 |
9.10 - 10.24 |
0.5861 times |
Fri 22 August 2025 |
10.11 (11.1%) |
9.10 |
9.06 - 10.85 |
1.4089 times |
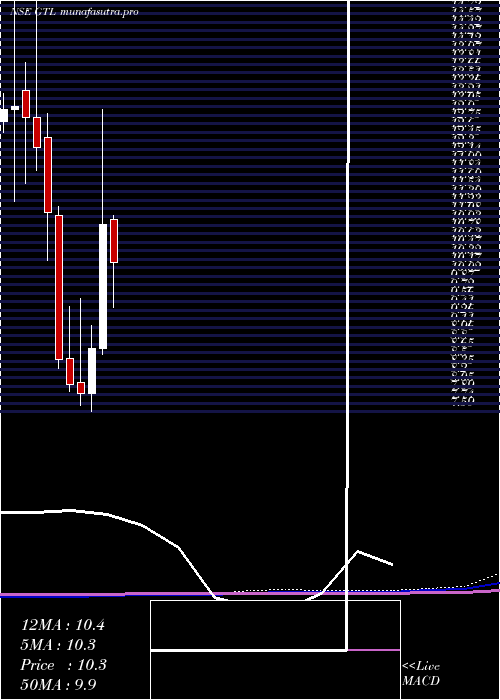
Monthly price and charts Gtl Strong monthly Stock price targets for Gtl GTL are 8.84 and 9.46 | Monthly Target 1 | 8.71 | | Monthly Target 2 | 8.96 | | Monthly Target 3 | 9.33 | | Monthly Target 4 | 9.58 | | Monthly Target 5 | 9.95 |
Monthly price and volumes Gtl
| Date |
Closing |
Open |
Range |
Volume |
Tue 28 October 2025 |
9.21 (-2.64%) |
9.55 |
9.08 - 9.70 |
0.2848 times |
Tue 30 September 2025 |
9.46 (3.05%) |
9.15 |
8.41 - 11.26 |
1.7212 times |
Fri 29 August 2025 |
9.18 (-1.82%) |
9.35 |
8.55 - 10.85 |
0.5667 times |
Thu 31 July 2025 |
9.35 (-14.61%) |
11.04 |
9.00 - 11.10 |
0.6025 times |
Mon 30 June 2025 |
10.95 (25.43%) |
8.72 |
8.61 - 13.00 |
3.2467 times |
Fri 30 May 2025 |
8.73 (10.23%) |
7.92 |
7.59 - 9.13 |
0.5845 times |
Wed 30 April 2025 |
7.92 (-1.98%) |
8.12 |
7.71 - 9.63 |
0.9388 times |
Fri 28 March 2025 |
8.08 (-5.16%) |
8.55 |
7.95 - 9.47 |
0.6819 times |
Fri 28 February 2025 |
8.52 (-23.66%) |
11.11 |
8.36 - 11.27 |
0.5057 times |
Fri 31 January 2025 |
11.16 (-9.42%) |
12.50 |
10.30 - 12.93 |
0.8672 times |
Tue 31 December 2024 |
12.32 (-4.27%) |
12.87 |
11.91 - 14.95 |
1.8823 times |
DMA SMA EMA moving averages of Gtl GTL
DMA (daily moving average) of Gtl GTL
| DMA period | DMA value | | 5 day DMA | 9.2 | | 12 day DMA | 9.21 | | 20 day DMA | 9.31 | | 35 day DMA | 9.39 | | 50 day DMA | 9.4 | | 100 day DMA | 9.72 | | 150 day DMA | 9.3 | | 200 day DMA | 9.5 | EMA (exponential moving average) of Gtl GTL
| EMA period | EMA current | EMA prev | EMA prev2 | | 5 day EMA | 9.2 | 9.2 | 9.18 | | 12 day EMA | 9.24 | 9.25 | 9.25 | | 20 day EMA | 9.29 | 9.3 | 9.31 | | 35 day EMA | 9.32 | 9.33 | 9.33 | | 50 day EMA | 9.34 | 9.35 | 9.35 |
SMA (simple moving average) of Gtl GTL
| SMA period | SMA current | SMA prev | SMA prev2 | | 5 day SMA | 9.2 | 9.2 | 9.17 | | 12 day SMA | 9.21 | 9.23 | 9.24 | | 20 day SMA | 9.31 | 9.31 | 9.32 | | 35 day SMA | 9.39 | 9.39 | 9.39 | | 50 day SMA | 9.4 | 9.39 | 9.39 | | 100 day SMA | 9.72 | 9.71 | 9.71 | | 150 day SMA | 9.3 | 9.3 | 9.29 | | 200 day SMA | 9.5 | 9.52 | 9.53 |
|
|
