GTec GTECJAINX full analysis,charts,indicators,moving averages,SMA,DMA,EMA,ADX,MACD,RSIG Tec GTECJAINX WideScreen charts, DMA,SMA,EMA technical analysis, forecast prediction, by indicators ADX,MACD,RSI,CCI NSE stock exchange
Daily price and charts and targets GTec Strong Daily Stock price targets for GTec GTECJAINX are 23.02 and 27.07 | Daily Target 1 | 20.19 | | Daily Target 2 | 21.79 | | Daily Target 3 | 24.236666666667 | | Daily Target 4 | 25.84 | | Daily Target 5 | 28.29 |
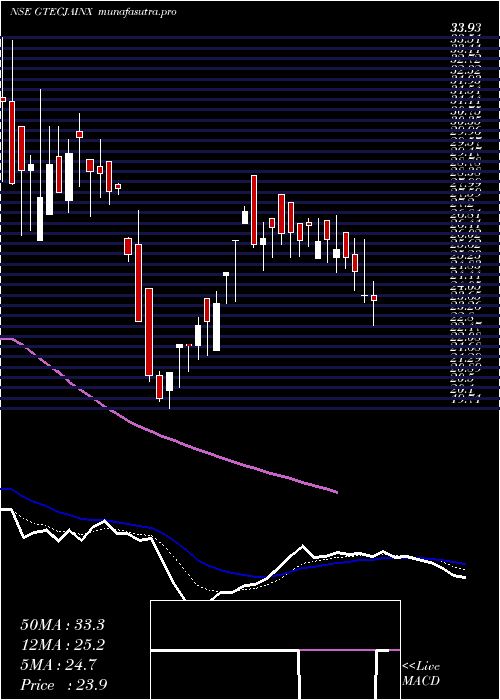
Daily price and volume G Tec
| Date |
Closing |
Open |
Range |
Volume |
Wed 29 October 2025 |
23.40 (-6.96%) |
22.63 |
22.63 - 26.68 |
2.1097 times |
Tue 28 October 2025 |
25.15 (-4.84%) |
26.44 |
25.15 - 26.46 |
0.3922 times |
Mon 27 October 2025 |
26.43 (-3.93%) |
27.88 |
26.00 - 27.88 |
1.0067 times |
Fri 24 October 2025 |
27.51 (8.82%) |
25.54 |
25.54 - 27.80 |
4.7846 times |
Thu 23 October 2025 |
25.28 (8.87%) |
25.54 |
24.05 - 25.54 |
0.3942 times |
Tue 21 October 2025 |
23.22 (-3.29%) |
24.11 |
21.82 - 24.11 |
0.1046 times |
Mon 20 October 2025 |
24.01 (-3.61%) |
25.00 |
24.01 - 25.80 |
0.0957 times |
Fri 17 October 2025 |
24.91 (-2.2%) |
24.61 |
24.06 - 26.00 |
0.4779 times |
Thu 16 October 2025 |
25.47 (7.15%) |
26.14 |
24.30 - 26.14 |
0.4718 times |
Wed 15 October 2025 |
23.77 (-1.16%) |
24.17 |
23.76 - 24.17 |
0.1626 times |
Tue 14 October 2025 |
24.05 (-2.51%) |
24.23 |
23.75 - 24.30 |
0.1282 times |
Weekly price and charts GTec Strong weekly Stock price targets for GTec GTECJAINX are 20.39 and 25.64 | Weekly Target 1 | 19.39 | | Weekly Target 2 | 21.39 | | Weekly Target 3 | 24.636666666667 | | Weekly Target 4 | 26.64 | | Weekly Target 5 | 29.89 |
Weekly price and volumes for G Tec
| Date |
Closing |
Open |
Range |
Volume |
Wed 29 October 2025 |
23.40 (-14.94%) |
27.88 |
22.63 - 27.88 |
1.1816 times |
Fri 24 October 2025 |
27.51 (10.44%) |
25.00 |
21.82 - 27.80 |
1.8116 times |
Fri 17 October 2025 |
24.91 (3.36%) |
24.58 |
23.75 - 26.25 |
0.4463 times |
Fri 10 October 2025 |
24.10 (-8.68%) |
26.92 |
23.33 - 27.40 |
0.3295 times |
Fri 03 October 2025 |
26.39 (1.5%) |
27.30 |
24.11 - 27.30 |
0.3905 times |
Fri 26 September 2025 |
26.00 (-1.63%) |
27.67 |
24.16 - 27.67 |
0.431 times |
Fri 19 September 2025 |
26.43 (10.82%) |
24.10 |
22.05 - 26.80 |
0.7352 times |
Fri 06 June 2025 |
23.85 (-8.93%) |
25.49 |
22.87 - 27.09 |
2.1587 times |
Fri 30 May 2025 |
26.19 (-0.8%) |
27.60 |
25.30 - 27.60 |
1.099 times |
Fri 23 May 2025 |
26.40 (0.99%) |
26.80 |
25.00 - 28.61 |
1.4167 times |
Fri 16 May 2025 |
26.14 (18.28%) |
22.10 |
21.60 - 26.14 |
2.2241 times |

Monthly price and charts GTec Strong monthly Stock price targets for GTec GTECJAINX are 19.58 and 25.64 | Monthly Target 1 | 18.31 | | Monthly Target 2 | 20.85 | | Monthly Target 3 | 24.366666666667 | | Monthly Target 4 | 26.91 | | Monthly Target 5 | 30.43 |
Monthly price and volumes G Tec
| Date |
Closing |
Open |
Range |
Volume |
Wed 29 October 2025 |
23.40 (-3.31%) |
24.20 |
21.82 - 27.88 |
0.5902 times |
Tue 30 September 2025 |
24.20 (1.47%) |
24.10 |
22.05 - 27.67 |
0.1816 times |
Fri 06 June 2025 |
23.85 (-8.93%) |
25.49 |
22.87 - 27.09 |
0.3128 times |
Fri 30 May 2025 |
26.19 (2.3%) |
26.00 |
19.71 - 28.61 |
2.5553 times |
Wed 30 April 2025 |
25.60 (-20.62%) |
32.34 |
25.32 - 34.05 |
2.1402 times |
Fri 28 March 2025 |
32.25 (-26.45%) |
33.80 |
30.83 - 37.00 |
0.1143 times |
Wed 23 October 2024 |
43.85 (-49.04%) |
56.05 |
41.51 - 60.00 |
0.816 times |
Wed 21 February 2024 |
86.05 (-32.72%) |
85.50 |
79.70 - 96.50 |
0.1399 times |
Thu 28 December 2023 |
127.90 (0%) |
97.00 |
96.00 - 140.65 |
2.1497 times |
Wed 29 October 2025 |
(0%) |
|
- |
0 times |

DMA SMA EMA moving averages of G Tec GTECJAINX
DMA (daily moving average) of G Tec GTECJAINX
| DMA period | DMA value | | 5 day DMA | 25.55 | | 12 day DMA | 24.82 | | 20 day DMA | 24.91 | | 35 day DMA | 24.99 | | 50 day DMA | 25.25 | | 100 day DMA | 30.94 | | 150 day DMA | | | 200 day DMA | | EMA (exponential moving average) of G Tec GTECJAINX
| EMA period | EMA current | EMA prev | EMA prev2 | | 5 day EMA | 24.85 | 25.58 | 25.8 | | 12 day EMA | 24.95 | 25.23 | 25.25 | | 20 day EMA | 24.96 | 25.12 | 25.12 | | 35 day EMA | 24.91 | 25 | 24.99 | | 50 day EMA | 24.98 | 25.04 | 25.04 |
SMA (simple moving average) of G Tec GTECJAINX
| SMA period | SMA current | SMA prev | SMA prev2 | | 5 day SMA | 25.55 | 25.52 | 25.29 | | 12 day SMA | 24.82 | 24.88 | 24.8 | | 20 day SMA | 24.91 | 24.99 | 25.04 | | 35 day SMA | 24.99 | 25.06 | 25.09 | | 50 day SMA | 25.25 | 25.23 | 25.17 | | 100 day SMA | 30.94 | 31.59 | 32.26 | | 150 day SMA | | 200 day SMA |
|
|
