GsmFoils GSMFOILS_ST full analysis,charts,indicators,moving averages,SMA,DMA,EMA,ADX,MACD,RSIGsm Foils GSMFOILS_ST WideScreen charts, DMA,SMA,EMA technical analysis, forecast prediction, by indicators ADX,MACD,RSI,CCI NSE stock exchange
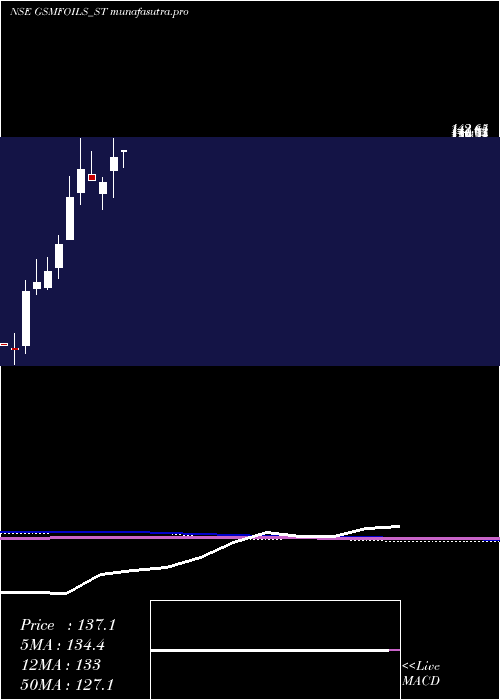
Daily price and charts and targets GsmFoils Strong Daily Stock price targets for GsmFoils GSMFOILS_ST are 227 and 236.8 | Daily Target 1 | 218.83 | | Daily Target 2 | 225.37 | | Daily Target 3 | 228.63333333333 | | Daily Target 4 | 235.17 | | Daily Target 5 | 238.43 |
Daily price and volume Gsm Foils
| Date |
Closing |
Open |
Range |
Volume |
Wed 03 September 2025 |
231.90 (4.98%) |
222.20 |
222.10 - 231.90 |
0.8333 times |
Tue 02 September 2025 |
220.90 (4.27%) |
206.05 |
206.00 - 221.80 |
0.3906 times |
Mon 01 September 2025 |
211.85 (-3.7%) |
215.00 |
210.00 - 220.00 |
0.4948 times |
Fri 29 August 2025 |
220.00 (-3.51%) |
228.00 |
220.00 - 231.95 |
0.3385 times |
Thu 28 August 2025 |
228.00 (1.09%) |
212.00 |
210.35 - 228.00 |
1.276 times |
Tue 26 August 2025 |
225.55 (4.86%) |
206.10 |
204.35 - 225.85 |
2.0052 times |
Mon 25 August 2025 |
215.10 (-4.99%) |
221.00 |
215.10 - 221.00 |
0.651 times |
Fri 22 August 2025 |
226.40 (-4.05%) |
247.70 |
224.15 - 247.70 |
1.7188 times |
Thu 21 August 2025 |
235.95 (4.98%) |
229.00 |
228.00 - 235.95 |
0.8594 times |
Wed 20 August 2025 |
224.75 (-4.91%) |
238.70 |
224.55 - 244.90 |
1.4323 times |
Tue 19 August 2025 |
236.35 (5%) |
232.00 |
221.50 - 236.35 |
1.6406 times |
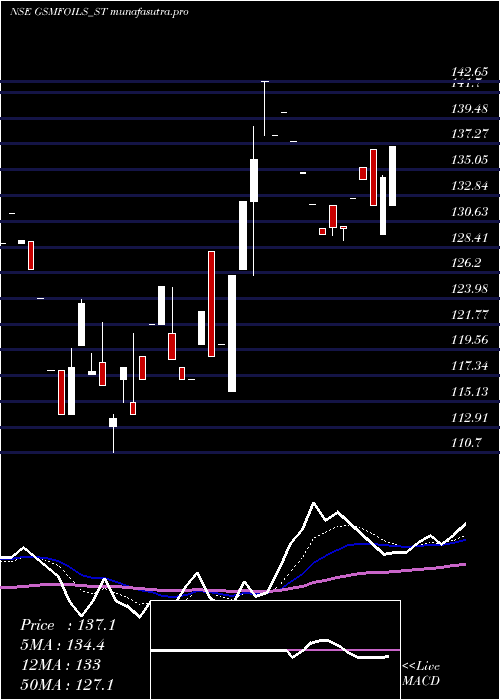
Weekly price and charts GsmFoils Strong weekly Stock price targets for GsmFoils GSMFOILS_ST are 218.95 and 244.85 | Weekly Target 1 | 197.37 | | Weekly Target 2 | 214.63 | | Weekly Target 3 | 223.26666666667 | | Weekly Target 4 | 240.53 | | Weekly Target 5 | 249.17 |
Weekly price and volumes for Gsm Foils
| Date |
Closing |
Open |
Range |
Volume |
Wed 03 September 2025 |
231.90 (5.41%) |
215.00 |
206.00 - 231.90 |
0.3793 times |
Fri 29 August 2025 |
220.00 (-2.83%) |
221.00 |
204.35 - 231.95 |
0.9425 times |
Fri 22 August 2025 |
226.40 (5.6%) |
225.00 |
219.00 - 247.70 |
1.4943 times |
Thu 14 August 2025 |
214.40 (3.93%) |
202.20 |
200.05 - 214.50 |
0.8678 times |
Fri 08 August 2025 |
206.30 (-6.5%) |
225.05 |
206.20 - 226.50 |
0.7874 times |
Fri 01 August 2025 |
220.65 (9.5%) |
205.50 |
205.50 - 220.65 |
1.6724 times |
Fri 25 July 2025 |
201.50 (6.05%) |
193.80 |
193.80 - 207.80 |
1.3103 times |
Fri 18 July 2025 |
190.00 (2.7%) |
184.95 |
183.95 - 195.55 |
0.5057 times |
Fri 11 July 2025 |
185.00 (14.73%) |
169.30 |
169.25 - 195.90 |
1.5115 times |
Fri 04 July 2025 |
161.25 (2.32%) |
158.90 |
155.00 - 164.95 |
0.5287 times |
Fri 27 June 2025 |
157.60 (3.68%) |
152.00 |
148.00 - 166.85 |
0.3448 times |
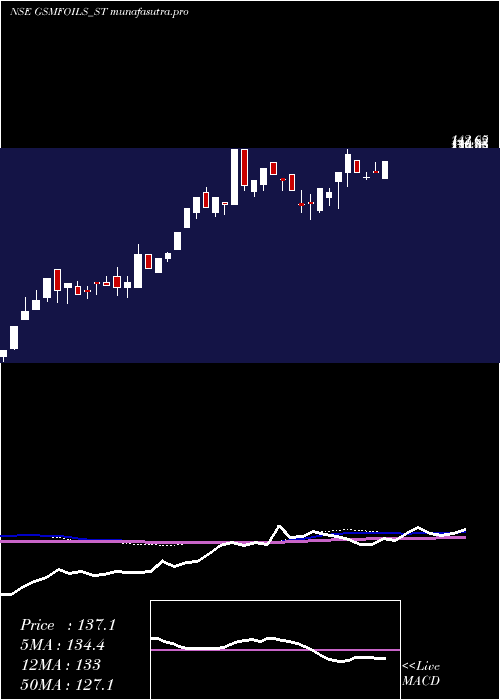
Monthly price and charts GsmFoils Strong monthly Stock price targets for GsmFoils GSMFOILS_ST are 218.95 and 244.85 | Monthly Target 1 | 197.37 | | Monthly Target 2 | 214.63 | | Monthly Target 3 | 223.26666666667 | | Monthly Target 4 | 240.53 | | Monthly Target 5 | 249.17 |
Monthly price and volumes Gsm Foils
| Date |
Closing |
Open |
Range |
Volume |
Wed 03 September 2025 |
231.90 (5.41%) |
215.00 |
206.00 - 231.90 |
0.1423 times |
Fri 29 August 2025 |
220.00 (1.69%) |
220.65 |
200.05 - 247.70 |
1.5952 times |
Thu 31 July 2025 |
216.35 (31.92%) |
163.20 |
156.00 - 216.35 |
1.9638 times |
Mon 30 June 2025 |
164.00 (9.33%) |
153.00 |
133.10 - 166.85 |
1.2869 times |
Fri 30 May 2025 |
150.00 (11.77%) |
136.80 |
129.50 - 164.00 |
1.0239 times |
Wed 30 April 2025 |
134.20 (9.24%) |
128.00 |
116.00 - 142.65 |
0.6079 times |
Fri 28 March 2025 |
122.85 (-0.89%) |
117.75 |
110.70 - 125.00 |
0.4742 times |
Fri 28 February 2025 |
123.95 (-3.5%) |
126.50 |
123.75 - 136.75 |
0.7803 times |
Fri 31 January 2025 |
128.45 (10.54%) |
118.45 |
113.00 - 142.65 |
1.2115 times |
Tue 31 December 2024 |
116.20 (21.8%) |
97.30 |
97.30 - 125.50 |
0.914 times |
Fri 29 November 2024 |
95.40 (14.73%) |
85.00 |
80.05 - 99.40 |
1.6512 times |
DMA SMA EMA moving averages of Gsm Foils GSMFOILS_ST
DMA (daily moving average) of Gsm Foils GSMFOILS_ST
| DMA period | DMA value | | 5 day DMA | 222.53 | | 12 day DMA | 225.15 | | 20 day DMA | 219.27 | | 35 day DMA | 212.44 | | 50 day DMA | 199.29 | | 100 day DMA | 172.04 | | 150 day DMA | 156.33 | | 200 day DMA | 143.22 | EMA (exponential moving average) of Gsm Foils GSMFOILS_ST
| EMA period | EMA current | EMA prev | EMA prev2 | | 5 day EMA | 224 | 220.05 | 219.62 | | 12 day EMA | 222.05 | 220.26 | 220.14 | | 20 day EMA | 218.46 | 217.05 | 216.64 | | 35 day EMA | 208.17 | 206.77 | 205.94 | | 50 day EMA | 197.81 | 196.42 | 195.42 |
SMA (simple moving average) of Gsm Foils GSMFOILS_ST
| SMA period | SMA current | SMA prev | SMA prev2 | | 5 day SMA | 222.53 | 221.26 | 220.1 | | 12 day SMA | 225.15 | 223.7 | 222.81 | | 20 day SMA | 219.27 | 218.85 | 218.84 | | 35 day SMA | 212.44 | 211.08 | 210.05 | | 50 day SMA | 199.29 | 197.69 | 196.31 | | 100 day SMA | 172.04 | 170.92 | 169.9 | | 150 day SMA | 156.33 | 155.57 | 154.86 | | 200 day SMA | 143.22 | 142.48 | 141.77 |
|
|
