GsmFoils GSMFOILS_SM full analysis,charts,indicators,moving averages,SMA,DMA,EMA,ADX,MACD,RSIGsm Foils GSMFOILS_SM WideScreen charts, DMA,SMA,EMA technical analysis, forecast prediction, by indicators ADX,MACD,RSI,CCI NSE stock exchange
Daily price and charts and targets GsmFoils Strong Daily Stock price targets for GsmFoils GSMFOILS_SM are 209.53 and 213.98 | Daily Target 1 | 206.07 | | Daily Target 2 | 208.53 | | Daily Target 3 | 210.51666666667 | | Daily Target 4 | 212.98 | | Daily Target 5 | 214.97 |
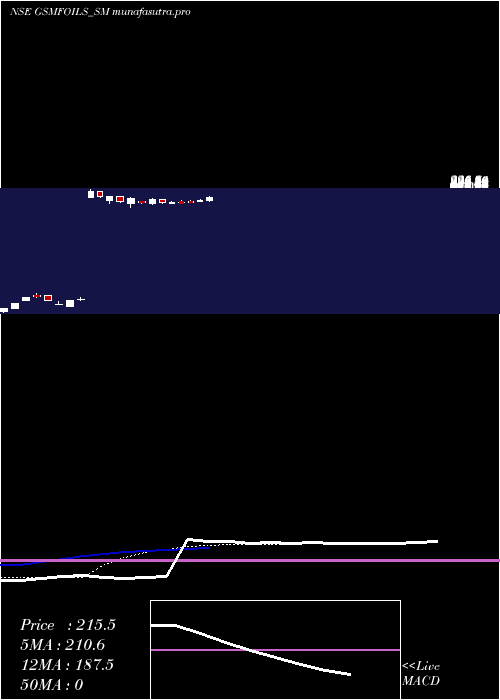
Daily price and volume Gsm Foils
| Date |
Closing |
Open |
Range |
Volume |
Wed 29 October 2025 |
211.00 (1.44%) |
208.10 |
208.05 - 212.50 |
0.4928 times |
Tue 28 October 2025 |
208.00 (0.43%) |
208.60 |
208.00 - 210.00 |
0.2609 times |
Mon 27 October 2025 |
207.10 (-0.31%) |
207.75 |
207.00 - 210.00 |
0.3478 times |
Fri 24 October 2025 |
207.75 (0.22%) |
206.00 |
206.00 - 209.00 |
0.6667 times |
Thu 23 October 2025 |
207.30 (-2.36%) |
212.55 |
206.00 - 212.55 |
0.8406 times |
Tue 21 October 2025 |
212.30 (2.17%) |
205.50 |
204.00 - 213.40 |
1.2174 times |
Mon 20 October 2025 |
207.80 (-2.97%) |
209.05 |
205.00 - 209.45 |
1.7681 times |
Fri 17 October 2025 |
214.15 (2.86%) |
205.00 |
200.00 - 214.35 |
1.7971 times |
Thu 16 October 2025 |
208.20 (-3.88%) |
216.00 |
207.10 - 216.00 |
1.8261 times |
Wed 15 October 2025 |
216.60 (0.07%) |
211.00 |
205.70 - 216.90 |
0.7826 times |
Tue 14 October 2025 |
216.45 (-3.8%) |
225.00 |
214.40 - 225.00 |
0.5217 times |
Weekly price and charts GsmFoils Strong weekly Stock price targets for GsmFoils GSMFOILS_SM are 209 and 214.5 | Weekly Target 1 | 204.67 | | Weekly Target 2 | 207.83 | | Weekly Target 3 | 210.16666666667 | | Weekly Target 4 | 213.33 | | Weekly Target 5 | 215.67 |
Weekly price and volumes for Gsm Foils
| Date |
Closing |
Open |
Range |
Volume |
Wed 29 October 2025 |
211.00 (1.56%) |
207.75 |
207.00 - 212.50 |
0.0695 times |
Fri 24 October 2025 |
207.75 (-2.99%) |
209.05 |
204.00 - 213.40 |
0.2834 times |
Fri 17 October 2025 |
214.15 (284.47%) |
215.00 |
200.00 - 226.80 |
0.3346 times |
Wed 26 June 2024 |
55.70 (0%) |
48.85 |
45.10 - 58.60 |
3.3126 times |
Thu 30 October 2025 |
(0%) |
|
- |
0 times |

Monthly price and charts GsmFoils Strong monthly Stock price targets for GsmFoils GSMFOILS_SM are 192.1 and 218.9 | Monthly Target 1 | 185.8 | | Monthly Target 2 | 198.4 | | Monthly Target 3 | 212.6 | | Monthly Target 4 | 225.2 | | Monthly Target 5 | 239.4 |
Monthly price and volumes Gsm Foils
| Date |
Closing |
Open |
Range |
Volume |
Wed 29 October 2025 |
211.00 (278.82%) |
215.00 |
200.00 - 226.80 |
0.1315 times |
Wed 26 June 2024 |
55.70 (0%) |
37.00 |
36.10 - 65.30 |
1.8685 times |
Thu 30 October 2025 |
(0%) |
|
- |
0 times |

DMA SMA EMA moving averages of Gsm Foils GSMFOILS_SM
DMA (daily moving average) of Gsm Foils GSMFOILS_SM
| DMA period | DMA value | | 5 day DMA | 208.23 | | 12 day DMA | 211.8 | | 20 day DMA | | | 35 day DMA | | | 50 day DMA | | | 100 day DMA | | | 150 day DMA | | | 200 day DMA | | EMA (exponential moving average) of Gsm Foils GSMFOILS_SM
| EMA period | EMA current | EMA prev | EMA prev2 | | 5 day EMA | 208.1 | 206.65 | 205.97 | | 12 day EMA | 182.42 | 177.22 | 171.62 | | 20 day EMA | 148.23 | | 35 day EMA | 0 | 0 | 0 | | 50 day EMA | 0 | 0 | 0 |
SMA (simple moving average) of Gsm Foils GSMFOILS_SM
| SMA period | SMA current | SMA prev | SMA prev2 | | 5 day SMA | 208.23 | 208.49 | 208.45 | | 12 day SMA | 211.8 | 198.86 | 186 | | 20 day SMA | | 35 day SMA | | 50 day SMA | | 100 day SMA | | 150 day SMA | | 200 day SMA |
|
|
