GlobalSurfaces GSLSU_BE full analysis,charts,indicators,moving averages,SMA,DMA,EMA,ADX,MACD,RSIGlobal Surfaces GSLSU_BE WideScreen charts, DMA,SMA,EMA technical analysis, forecast prediction, by indicators ADX,MACD,RSI,CCI NSE stock exchange
Daily price and charts and targets GlobalSurfaces Strong Daily Stock price targets for GlobalSurfaces GSLSU_BE are 111.13 and 121.38 | Daily Target 1 | 102.58 | | Daily Target 2 | 109.42 | | Daily Target 3 | 112.83333333333 | | Daily Target 4 | 119.67 | | Daily Target 5 | 123.08 |
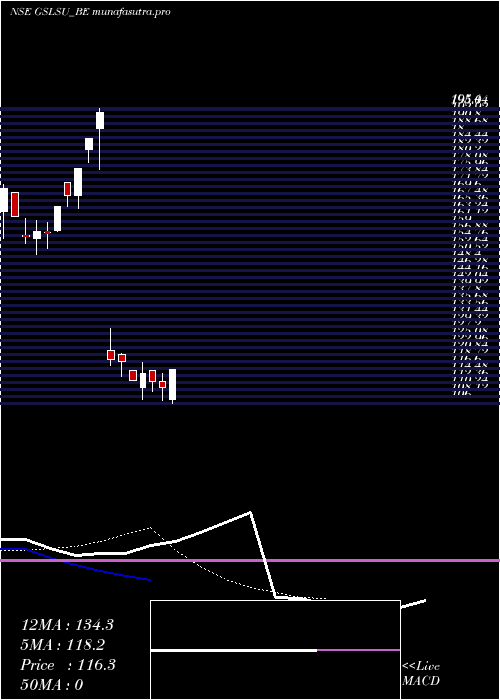
Daily price and volume Global Surfaces
| Date |
Closing |
Open |
Range |
Volume |
Wed 10 December 2025 |
116.25 (4.99%) |
107.25 |
106.00 - 116.25 |
0.3996 times |
Tue 09 December 2025 |
110.72 (-1.76%) |
112.62 |
107.07 - 115.00 |
0.6669 times |
Mon 08 December 2025 |
112.70 (-1.98%) |
116.00 |
109.50 - 116.00 |
0.1168 times |
Fri 05 December 2025 |
114.98 (1.89%) |
111.00 |
107.20 - 118.49 |
0.4931 times |
Thu 04 December 2025 |
112.85 (-5%) |
115.99 |
112.85 - 115.99 |
1.6492 times |
Wed 03 December 2025 |
118.79 (-0.58%) |
121.00 |
114.05 - 121.29 |
0.8836 times |
Tue 02 December 2025 |
119.48 (-38.49%) |
122.00 |
117.49 - 128.78 |
1.1255 times |
Mon 10 April 2023 |
194.25 (4.38%) |
189.30 |
176.80 - 195.40 |
1.3959 times |
Thu 06 April 2023 |
186.10 (4.99%) |
183.00 |
179.00 - 186.10 |
2.5267 times |
Wed 05 April 2023 |
177.25 (4.97%) |
168.85 |
165.15 - 177.25 |
0.7428 times |
Mon 03 April 2023 |
168.85 (1.93%) |
172.90 |
165.70 - 172.90 |
0.6044 times |
Weekly price and charts GlobalSurfaces Strong weekly Stock price targets for GlobalSurfaces GSLSU_BE are 111.13 and 121.38 | Weekly Target 1 | 102.58 | | Weekly Target 2 | 109.42 | | Weekly Target 3 | 112.83333333333 | | Weekly Target 4 | 119.67 | | Weekly Target 5 | 123.08 |
Weekly price and volumes for Global Surfaces
| Date |
Closing |
Open |
Range |
Volume |
Wed 10 December 2025 |
116.25 (1.1%) |
116.00 |
106.00 - 116.25 |
0.3166 times |
Fri 05 December 2025 |
114.98 (-38.22%) |
189.30 |
107.20 - 195.40 |
1.4841 times |
Thu 06 April 2023 |
186.10 (12.35%) |
172.90 |
165.15 - 186.10 |
1.0364 times |
Fri 31 March 2023 |
165.65 (0%) |
157.00 |
151.10 - 165.65 |
1.163 times |
Wed 10 December 2025 |
(0%) |
|
- |
0 times |

Monthly price and charts GlobalSurfaces Strong monthly Stock price targets for GlobalSurfaces GSLSU_BE are 99.74 and 122.52 | Monthly Target 1 | 94.23 | | Monthly Target 2 | 105.24 | | Monthly Target 3 | 117.01 | | Monthly Target 4 | 128.02 | | Monthly Target 5 | 139.79 |
Monthly price and volumes Global Surfaces
| Date |
Closing |
Open |
Range |
Volume |
Wed 10 December 2025 |
116.25 (-40.15%) |
122.00 |
106.00 - 128.78 |
0.4095 times |
Mon 10 April 2023 |
194.25 (17.27%) |
172.90 |
165.15 - 195.40 |
0.4045 times |
Fri 31 March 2023 |
165.65 (0%) |
164.00 |
151.10 - 172.20 |
2.1859 times |
Wed 10 December 2025 |
(0%) |
|
- |
0 times |

DMA SMA EMA moving averages of Global Surfaces GSLSU_BE
DMA (daily moving average) of Global Surfaces GSLSU_BE
| DMA period | DMA value | | 5 day DMA | 113.5 | | 12 day DMA | 141.49 | | 20 day DMA | | | 35 day DMA | | | 50 day DMA | | | 100 day DMA | | | 150 day DMA | | | 200 day DMA | | EMA (exponential moving average) of Global Surfaces GSLSU_BE
| EMA period | EMA current | EMA prev | EMA prev2 | | 5 day EMA | 118.15 | 119.1 | 123.29 | | 12 day EMA | 134.32 | 137.6 | 142.49 | | 20 day EMA | 0 | 0 | 0 | | 35 day EMA | 0 | 0 | 0 | | 50 day EMA | 0 | 0 | 0 |
SMA (simple moving average) of Global Surfaces GSLSU_BE
| SMA period | SMA current | SMA prev | SMA prev2 | | 5 day SMA | 113.5 | 114.01 | 115.76 | | 12 day SMA | 141.49 | 144.95 | 148.89 | | 20 day SMA | | 35 day SMA | | 50 day SMA | | 100 day SMA | | 150 day SMA | | 200 day SMA |
|
|
