GlobalSurfaces GSLSU full analysis,charts,indicators,moving averages,SMA,DMA,EMA,ADX,MACD,RSIGlobal Surfaces GSLSU WideScreen charts, DMA,SMA,EMA technical analysis, forecast prediction, by indicators ADX,MACD,RSI,CCI NSE stock exchange
Daily price and charts and targets GlobalSurfaces Strong Daily Stock price targets for GlobalSurfaces GSLSU are 98.08 and 100 | Daily Target 1 | 97.71 | | Daily Target 2 | 98.45 | | Daily Target 3 | 99.633333333333 | | Daily Target 4 | 100.37 | | Daily Target 5 | 101.55 |
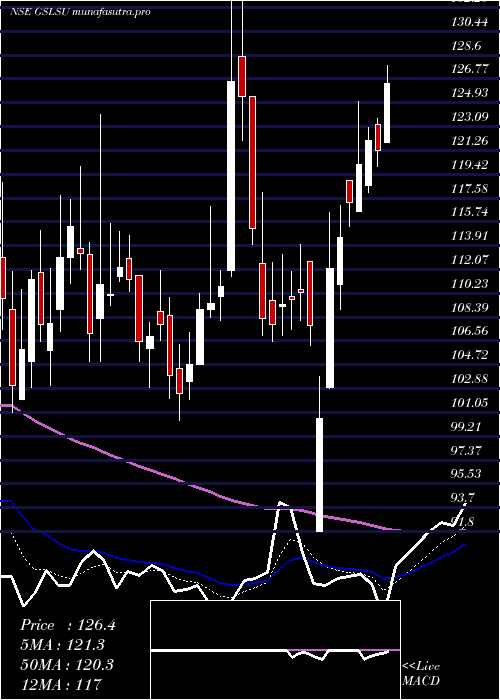
Daily price and volume Global Surfaces
| Date |
Closing |
Open |
Range |
Volume |
Wed 29 October 2025 |
99.18 (-0.88%) |
100.82 |
98.90 - 100.82 |
0.072 times |
Tue 28 October 2025 |
100.06 (-2.46%) |
102.70 |
99.11 - 104.01 |
0.1698 times |
Mon 27 October 2025 |
102.58 (0.8%) |
103.30 |
101.39 - 104.89 |
0.0861 times |
Fri 24 October 2025 |
101.77 (-2.01%) |
103.20 |
99.11 - 104.40 |
0.2147 times |
Thu 23 October 2025 |
103.86 (-7.42%) |
107.91 |
103.00 - 109.87 |
0.389 times |
Tue 21 October 2025 |
112.19 (3%) |
116.01 |
108.92 - 117.00 |
0.7541 times |
Mon 20 October 2025 |
108.92 (19.51%) |
91.14 |
87.33 - 109.36 |
5.8014 times |
Fri 17 October 2025 |
91.14 (5.74%) |
90.00 |
90.00 - 101.00 |
2.3285 times |
Thu 16 October 2025 |
86.19 (0.12%) |
86.80 |
85.00 - 88.48 |
0.0726 times |
Wed 15 October 2025 |
86.09 (-2.44%) |
88.10 |
85.55 - 89.90 |
0.1119 times |
Tue 14 October 2025 |
88.24 (-3.86%) |
92.00 |
84.85 - 93.19 |
0.2015 times |
Weekly price and charts GlobalSurfaces Strong weekly Stock price targets for GlobalSurfaces GSLSU are 96.05 and 102.04 | Weekly Target 1 | 95 | | Weekly Target 2 | 97.09 | | Weekly Target 3 | 100.99 | | Weekly Target 4 | 103.08 | | Weekly Target 5 | 106.98 |
Weekly price and volumes for Global Surfaces
| Date |
Closing |
Open |
Range |
Volume |
Wed 29 October 2025 |
99.18 (-2.54%) |
103.30 |
98.90 - 104.89 |
0.2016 times |
Fri 24 October 2025 |
101.77 (11.66%) |
91.14 |
87.33 - 117.00 |
4.4026 times |
Fri 17 October 2025 |
91.14 (-2.71%) |
93.95 |
84.85 - 101.00 |
1.6908 times |
Fri 10 October 2025 |
93.68 (-3.48%) |
97.80 |
92.12 - 99.63 |
0.3966 times |
Fri 03 October 2025 |
97.06 (6.29%) |
94.00 |
84.71 - 102.00 |
1.797 times |
Fri 26 September 2025 |
91.32 (-11.58%) |
103.28 |
90.25 - 103.95 |
0.2771 times |
Fri 19 September 2025 |
103.28 (1.04%) |
102.90 |
101.69 - 105.99 |
0.2155 times |
Fri 12 September 2025 |
102.22 (-2.68%) |
108.80 |
99.90 - 108.80 |
0.4642 times |
Fri 05 September 2025 |
105.04 (-2.75%) |
111.69 |
104.51 - 112.70 |
0.4093 times |
Fri 29 August 2025 |
108.01 (-5.83%) |
115.09 |
106.11 - 115.65 |
0.1452 times |
Fri 22 August 2025 |
114.70 (-6.51%) |
122.80 |
113.32 - 125.74 |
0.2576 times |

Monthly price and charts GlobalSurfaces Strong monthly Stock price targets for GlobalSurfaces GSLSU are 92.02 and 124.17 | Monthly Target 1 | 68.19 | | Monthly Target 2 | 83.69 | | Monthly Target 3 | 100.34333333333 | | Monthly Target 4 | 115.84 | | Monthly Target 5 | 132.49 |
Monthly price and volumes Global Surfaces
| Date |
Closing |
Open |
Range |
Volume |
Wed 29 October 2025 |
99.18 (16.19%) |
86.50 |
84.85 - 117.00 |
2.3778 times |
Tue 30 September 2025 |
85.36 (-20.97%) |
111.69 |
84.71 - 112.70 |
0.441 times |
Fri 29 August 2025 |
108.01 (-3.21%) |
110.46 |
106.11 - 126.90 |
0.3238 times |
Thu 31 July 2025 |
111.59 (-5.36%) |
118.90 |
108.64 - 137.00 |
1.3765 times |
Mon 30 June 2025 |
117.91 (-10.2%) |
131.95 |
113.10 - 142.98 |
1.2416 times |
Fri 30 May 2025 |
131.31 (19.71%) |
110.87 |
102.18 - 144.40 |
0.8923 times |
Wed 30 April 2025 |
109.69 (1.74%) |
109.25 |
91.86 - 129.00 |
0.4233 times |
Fri 28 March 2025 |
107.81 (-4.86%) |
113.22 |
100.42 - 134.65 |
1.4243 times |
Fri 28 February 2025 |
113.32 (-15.31%) |
137.95 |
101.00 - 138.00 |
0.5399 times |
Fri 31 January 2025 |
133.80 (-20.63%) |
166.10 |
127.99 - 172.40 |
0.9596 times |
Tue 31 December 2024 |
168.57 (-7.95%) |
183.01 |
164.51 - 192.00 |
0.3833 times |

DMA SMA EMA moving averages of Global Surfaces GSLSU
DMA (daily moving average) of Global Surfaces GSLSU
| DMA period | DMA value | | 5 day DMA | 101.49 | | 12 day DMA | 97.67 | | 20 day DMA | 96.1 | | 35 day DMA | 98.15 | | 50 day DMA | 102.34 | | 100 day DMA | 111.16 | | 150 day DMA | 113.62 | | 200 day DMA | 116.69 | EMA (exponential moving average) of Global Surfaces GSLSU
| EMA period | EMA current | EMA prev | EMA prev2 | | 5 day EMA | 100.73 | 101.5 | 102.22 | | 12 day EMA | 99.3 | 99.32 | 99.19 | | 20 day EMA | 98.75 | 98.71 | 98.57 | | 35 day EMA | 100.93 | 101.03 | 101.09 | | 50 day EMA | 103.82 | 104.01 | 104.17 |
SMA (simple moving average) of Global Surfaces GSLSU
| SMA period | SMA current | SMA prev | SMA prev2 | | 5 day SMA | 101.49 | 104.09 | 105.86 | | 12 day SMA | 97.67 | 97.21 | 96.63 | | 20 day SMA | 96.1 | 95.66 | 95.22 | | 35 day SMA | 98.15 | 98.35 | 98.5 | | 50 day SMA | 102.34 | 102.81 | 103.25 | | 100 day SMA | 111.16 | 111.44 | 111.71 | | 150 day SMA | 113.62 | 113.69 | 113.75 | | 200 day SMA | 116.69 | 116.96 | 117.24 |
|
|
