MiraeamcMags813etf GSEC10YEAR full analysis,charts,indicators,moving averages,SMA,DMA,EMA,ADX,MACD,RSIMiraeamc Mags813etf GSEC10YEAR WideScreen charts, DMA,SMA,EMA technical analysis, forecast prediction, by indicators ADX,MACD,RSI,CCI NSE stock exchange
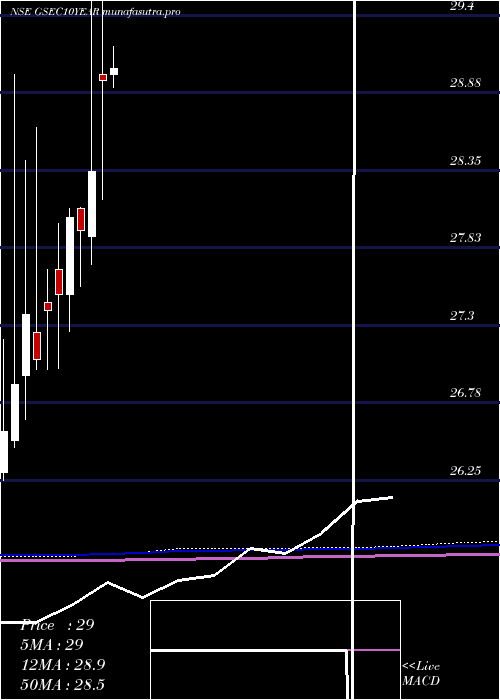
Daily price and charts and targets MiraeamcMags813etf Strong Daily Stock price targets for MiraeamcMags813etf GSEC10YEAR are 29.37 and 29.45 | Daily Target 1 | 29.3 | | Daily Target 2 | 29.36 | | Daily Target 3 | 29.383333333333 | | Daily Target 4 | 29.44 | | Daily Target 5 | 29.46 |
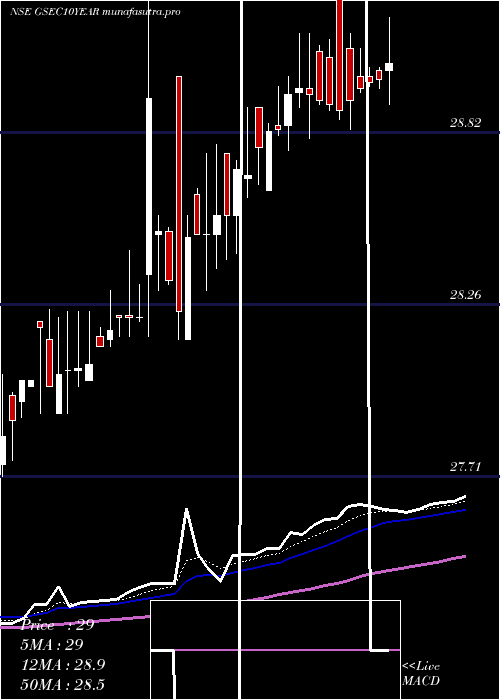
Daily price and volume Miraeamc Mags813etf
| Date |
Closing |
Open |
Range |
Volume |
Tue 28 October 2025 |
29.41 (0.24%) |
29.39 |
29.33 - 29.41 |
3.4172 times |
Mon 27 October 2025 |
29.34 (-0.14%) |
29.36 |
29.27 - 29.43 |
3.2119 times |
Fri 24 October 2025 |
29.38 (0.14%) |
29.42 |
29.25 - 29.42 |
2.0551 times |
Thu 23 October 2025 |
29.34 (0%) |
29.47 |
29.28 - 29.47 |
0.4261 times |
Tue 21 October 2025 |
29.34 (-0.34%) |
29.71 |
29.16 - 29.71 |
0.1579 times |
Mon 20 October 2025 |
29.44 (0.2%) |
29.38 |
29.36 - 29.55 |
0.1018 times |
Fri 17 October 2025 |
29.38 (-0.03%) |
29.45 |
29.33 - 29.45 |
0.0053 times |
Thu 16 October 2025 |
29.39 (0.07%) |
29.48 |
29.39 - 29.49 |
0.0986 times |
Wed 15 October 2025 |
29.37 (0%) |
29.44 |
29.30 - 29.44 |
0.5029 times |
Tue 14 October 2025 |
29.37 (0.55%) |
29.49 |
29.37 - 29.49 |
0.0233 times |
Mon 13 October 2025 |
29.21 (-0.31%) |
29.39 |
29.21 - 29.41 |
5.4377 times |
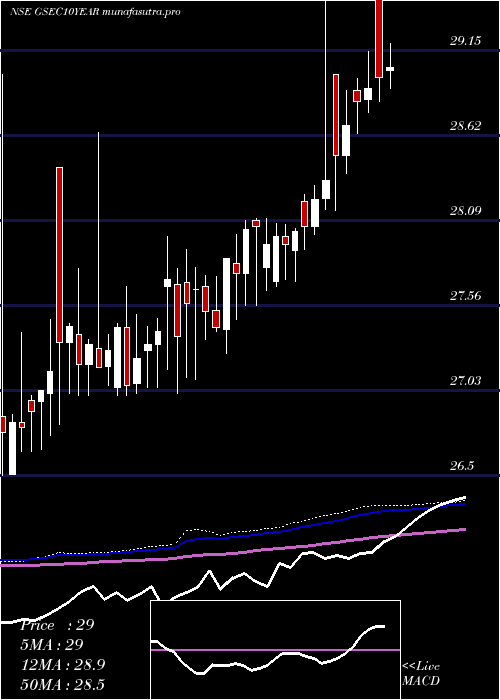
Weekly price and charts MiraeamcMags813etf Strong weekly Stock price targets for MiraeamcMags813etf GSEC10YEAR are 29.34 and 29.5 | Weekly Target 1 | 29.21 | | Weekly Target 2 | 29.31 | | Weekly Target 3 | 29.37 | | Weekly Target 4 | 29.47 | | Weekly Target 5 | 29.53 |
Weekly price and volumes for Miraeamc Mags813etf
| Date |
Closing |
Open |
Range |
Volume |
Tue 28 October 2025 |
29.41 (0.1%) |
29.36 |
29.27 - 29.43 |
1.0454 times |
Fri 24 October 2025 |
29.38 (0%) |
29.38 |
29.16 - 29.71 |
0.4322 times |
Fri 17 October 2025 |
29.38 (0.27%) |
29.39 |
29.21 - 29.49 |
0.9569 times |
Fri 10 October 2025 |
29.30 (0.03%) |
29.39 |
29.24 - 29.51 |
0.8427 times |
Fri 03 October 2025 |
29.29 (-0.24%) |
30.24 |
28.53 - 30.24 |
0.4231 times |
Fri 26 September 2025 |
29.36 (0.34%) |
29.26 |
29.13 - 29.45 |
0.3275 times |
Fri 19 September 2025 |
29.26 (0.34%) |
29.35 |
29.08 - 29.37 |
2.4485 times |
Fri 12 September 2025 |
29.16 (-0.03%) |
29.17 |
29.00 - 29.36 |
1.1894 times |
Fri 05 September 2025 |
29.17 (0.45%) |
29.04 |
28.82 - 29.35 |
1.2179 times |
Fri 29 August 2025 |
29.04 (-0.51%) |
29.08 |
28.75 - 29.19 |
1.1163 times |
Fri 22 August 2025 |
29.19 (-1.05%) |
29.27 |
28.91 - 29.82 |
1.5232 times |
Monthly price and charts MiraeamcMags813etf Strong monthly Stock price targets for MiraeamcMags813etf GSEC10YEAR are 28.97 and 30.15 | Monthly Target 1 | 28.04 | | Monthly Target 2 | 28.72 | | Monthly Target 3 | 29.216666666667 | | Monthly Target 4 | 29.9 | | Monthly Target 5 | 30.4 |
Monthly price and volumes Miraeamc Mags813etf
| Date |
Closing |
Open |
Range |
Volume |
Tue 28 October 2025 |
29.41 (0.48%) |
28.53 |
28.53 - 29.71 |
0.6988 times |
Tue 30 September 2025 |
29.27 (0.79%) |
29.04 |
28.82 - 30.24 |
1.1344 times |
Fri 29 August 2025 |
29.04 (-0.72%) |
29.25 |
28.75 - 30.80 |
1.0222 times |
Thu 31 July 2025 |
29.25 (0.27%) |
29.89 |
28.56 - 30.01 |
0.269 times |
Mon 30 June 2025 |
29.17 (-0.48%) |
29.31 |
28.37 - 29.77 |
0.8769 times |
Fri 30 May 2025 |
29.31 (1.21%) |
29.00 |
28.81 - 29.45 |
1.5396 times |
Wed 30 April 2025 |
28.96 (2.19%) |
29.00 |
28.15 - 29.93 |
1.9949 times |
Fri 28 March 2025 |
28.34 (1.43%) |
27.90 |
27.71 - 31.00 |
0.8338 times |
Fri 28 February 2025 |
27.94 (-0.32%) |
28.09 |
27.56 - 28.10 |
0.8103 times |
Fri 31 January 2025 |
28.03 (1.89%) |
27.51 |
27.26 - 28.09 |
0.82 times |
Tue 31 December 2024 |
27.51 (0.4%) |
27.68 |
27.01 - 27.99 |
0.2792 times |
DMA SMA EMA moving averages of Miraeamc Mags813etf GSEC10YEAR
DMA (daily moving average) of Miraeamc Mags813etf GSEC10YEAR
| DMA period | DMA value | | 5 day DMA | 29.36 | | 12 day DMA | 29.36 | | 20 day DMA | 29.35 | | 35 day DMA | 29.3 | | 50 day DMA | 29.24 | | 100 day DMA | 29.24 | | 150 day DMA | 29.12 | | 200 day DMA | 28.81 | EMA (exponential moving average) of Miraeamc Mags813etf GSEC10YEAR
| EMA period | EMA current | EMA prev | EMA prev2 | | 5 day EMA | 29.38 | 29.36 | 29.37 | | 12 day EMA | 29.37 | 29.36 | 29.36 | | 20 day EMA | 29.35 | 29.34 | 29.34 | | 35 day EMA | 29.31 | 29.3 | 29.3 | | 50 day EMA | 29.24 | 29.23 | 29.23 |
SMA (simple moving average) of Miraeamc Mags813etf GSEC10YEAR
| SMA period | SMA current | SMA prev | SMA prev2 | | 5 day SMA | 29.36 | 29.37 | 29.38 | | 12 day SMA | 29.36 | 29.36 | 29.37 | | 20 day SMA | 29.35 | 29.35 | 29.34 | | 35 day SMA | 29.3 | 29.3 | 29.3 | | 50 day SMA | 29.24 | 29.23 | 29.23 | | 100 day SMA | 29.24 | 29.24 | 29.24 | | 150 day SMA | 29.12 | 29.11 | 29.1 | | 200 day SMA | 28.81 | 28.8 | 28.8 |
|
|
