IcicipramcIcici10gs GSEC10IETF full analysis,charts,indicators,moving averages,SMA,DMA,EMA,ADX,MACD,RSIIcicipramc Icici10gs GSEC10IETF WideScreen charts, DMA,SMA,EMA technical analysis, forecast prediction, by indicators ADX,MACD,RSI,CCI NSE stock exchange
Daily price and charts and targets IcicipramcIcici10gs Strong Daily Stock price targets for IcicipramcIcici10gs GSEC10IETF are 258.41 and 259.04 | Daily Target 1 | 257.89 | | Daily Target 2 | 258.29 | | Daily Target 3 | 258.51666666667 | | Daily Target 4 | 258.92 | | Daily Target 5 | 259.15 |
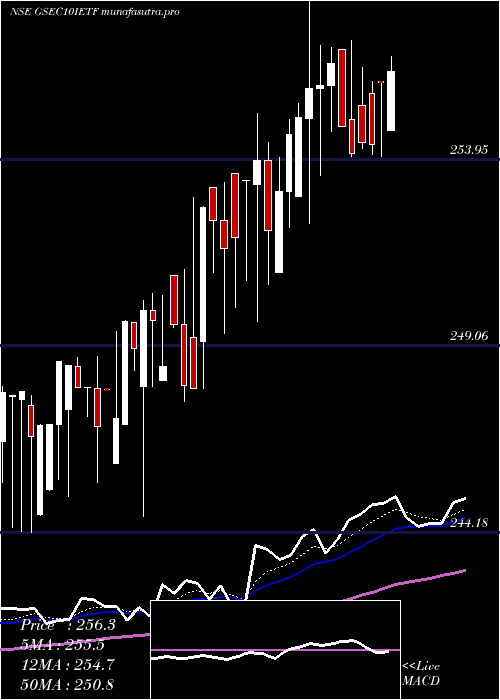
Daily price and volume Icicipramc Icici10gs
| Date |
Closing |
Open |
Range |
Volume |
Wed 29 October 2025 |
258.70 (0.23%) |
258.11 |
258.11 - 258.74 |
0.1663 times |
Tue 28 October 2025 |
258.11 (0.01%) |
258.10 |
258.08 - 259.11 |
0.314 times |
Mon 27 October 2025 |
258.08 (-0.24%) |
258.51 |
258.08 - 258.70 |
0.3369 times |
Fri 24 October 2025 |
258.71 (0.22%) |
258.58 |
258.58 - 258.71 |
0.7082 times |
Thu 23 October 2025 |
258.14 (0.84%) |
258.30 |
258.06 - 258.93 |
4.3799 times |
Tue 21 October 2025 |
255.99 (-0.96%) |
258.49 |
255.95 - 258.50 |
0.2394 times |
Mon 20 October 2025 |
258.48 (-0.05%) |
257.51 |
257.51 - 258.59 |
0.2409 times |
Fri 17 October 2025 |
258.60 (-0.19%) |
258.75 |
258.15 - 258.78 |
0.7269 times |
Thu 16 October 2025 |
259.09 (0.12%) |
259.12 |
258.79 - 259.12 |
0.172 times |
Wed 15 October 2025 |
258.78 (0.25%) |
257.94 |
257.67 - 258.78 |
2.7154 times |
Tue 14 October 2025 |
258.14 (0.06%) |
258.42 |
257.78 - 258.42 |
8.0717 times |
Weekly price and charts IcicipramcIcici10gs Strong weekly Stock price targets for IcicipramcIcici10gs GSEC10IETF are 258.39 and 259.42 | Weekly Target 1 | 257.6 | | Weekly Target 2 | 258.15 | | Weekly Target 3 | 258.63 | | Weekly Target 4 | 259.18 | | Weekly Target 5 | 259.66 |
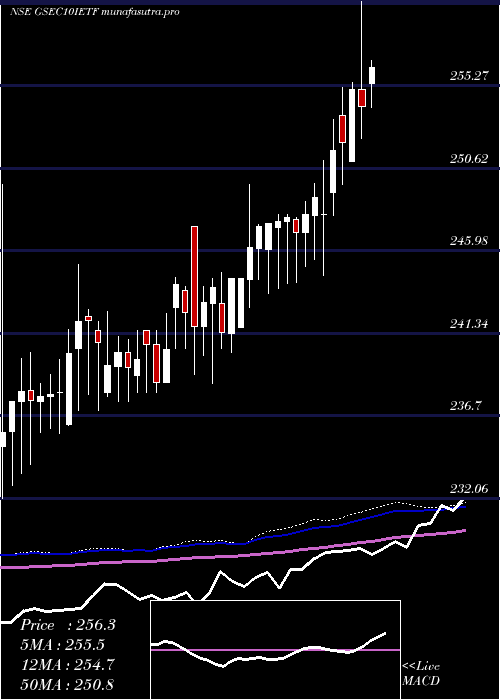
Weekly price and volumes for Icicipramc Icici10gs
| Date |
Closing |
Open |
Range |
Volume |
Wed 29 October 2025 |
258.70 (-0%) |
258.51 |
258.08 - 259.11 |
0.0829 times |
Fri 24 October 2025 |
258.71 (0.04%) |
257.51 |
255.95 - 258.93 |
0.5652 times |
Fri 17 October 2025 |
258.60 (0.08%) |
257.11 |
257.11 - 259.12 |
1.7974 times |
Fri 10 October 2025 |
258.40 (0.22%) |
257.69 |
257.01 - 259.43 |
1.956 times |
Fri 03 October 2025 |
257.84 (0.32%) |
264.74 |
255.40 - 264.74 |
0.5131 times |
Fri 26 September 2025 |
257.03 (-0.26%) |
257.15 |
256.62 - 258.58 |
1.0136 times |
Fri 19 September 2025 |
257.70 (0.26%) |
258.63 |
256.61 - 258.63 |
0.9021 times |
Fri 12 September 2025 |
257.04 (-0.35%) |
256.02 |
256.02 - 258.80 |
1.7905 times |
Fri 05 September 2025 |
257.95 (1.09%) |
255.16 |
254.06 - 257.99 |
0.4613 times |
Fri 29 August 2025 |
255.16 (-0.67%) |
256.32 |
254.10 - 256.32 |
0.9178 times |
Fri 22 August 2025 |
256.89 (0.25%) |
257.09 |
254.62 - 258.10 |
1.2036 times |
Monthly price and charts IcicipramcIcici10gs Strong monthly Stock price targets for IcicipramcIcici10gs GSEC10IETF are 257.05 and 261.08 | Monthly Target 1 | 253.81 | | Monthly Target 2 | 256.26 | | Monthly Target 3 | 257.84333333333 | | Monthly Target 4 | 260.29 | | Monthly Target 5 | 261.87 |
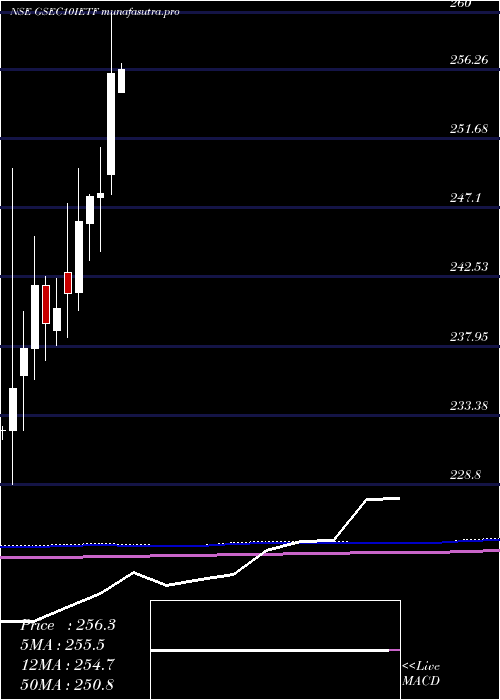
Monthly price and volumes Icicipramc Icici10gs
| Date |
Closing |
Open |
Range |
Volume |
Wed 29 October 2025 |
258.70 (0.47%) |
256.00 |
255.40 - 259.43 |
0.5906 times |
Tue 30 September 2025 |
257.49 (0.91%) |
255.16 |
254.06 - 264.74 |
0.5798 times |
Fri 29 August 2025 |
255.16 (-1.07%) |
256.85 |
253.05 - 259.37 |
0.5566 times |
Thu 31 July 2025 |
257.93 (-0.02%) |
258.50 |
253.50 - 265.36 |
1.7962 times |
Mon 30 June 2025 |
257.99 (-0.19%) |
258.48 |
254.02 - 262.00 |
1.2952 times |
Fri 30 May 2025 |
258.48 (0.97%) |
254.72 |
252.83 - 259.80 |
1.6176 times |
Wed 30 April 2025 |
255.99 (3.21%) |
249.28 |
247.95 - 260.00 |
1.7209 times |
Fri 28 March 2025 |
248.04 (0.08%) |
247.74 |
244.18 - 251.08 |
0.3367 times |
Fri 28 February 2025 |
247.85 (0.69%) |
246.10 |
243.60 - 248.00 |
0.8455 times |
Fri 31 January 2025 |
246.16 (1.95%) |
241.46 |
240.30 - 249.70 |
0.6609 times |
Tue 31 December 2024 |
241.45 (0.42%) |
242.79 |
238.55 - 247.36 |
0.5821 times |
DMA SMA EMA moving averages of Icicipramc Icici10gs GSEC10IETF
DMA (daily moving average) of Icicipramc Icici10gs GSEC10IETF
| DMA period | DMA value | | 5 day DMA | 258.35 | | 12 day DMA | 258.23 | | 20 day DMA | 258.1 | | 35 day DMA | 257.89 | | 50 day DMA | 257.39 | | 100 day DMA | 257.64 | | 150 day DMA | 256.73 | | 200 day DMA | 253.99 | EMA (exponential moving average) of Icicipramc Icici10gs GSEC10IETF
| EMA period | EMA current | EMA prev | EMA prev2 | | 5 day EMA | 258.31 | 258.12 | 258.12 | | 12 day EMA | 258.2 | 258.11 | 258.11 | | 20 day EMA | 258.07 | 258 | 257.99 | | 35 day EMA | 257.76 | 257.7 | 257.68 | | 50 day EMA | 257.46 | 257.41 | 257.38 |
SMA (simple moving average) of Icicipramc Icici10gs GSEC10IETF
| SMA period | SMA current | SMA prev | SMA prev2 | | 5 day SMA | 258.35 | 257.81 | 257.88 | | 12 day SMA | 258.23 | 258.21 | 258.27 | | 20 day SMA | 258.1 | 258 | 257.94 | | 35 day SMA | 257.89 | 257.87 | 257.86 | | 50 day SMA | 257.39 | 257.34 | 257.29 | | 100 day SMA | 257.64 | 257.63 | 257.62 | | 150 day SMA | 256.73 | 256.67 | 256.6 | | 200 day SMA | 253.99 | 253.91 | 253.83 |
|
|
