GardenReach GRSE full analysis,charts,indicators,moving averages,SMA,DMA,EMA,ADX,MACD,RSIGarden Reach GRSE WideScreen charts, DMA,SMA,EMA technical analysis, forecast prediction, by indicators ADX,MACD,RSI,CCI NSE stock exchange
Daily price and charts and targets GardenReach Strong Daily Stock price targets for GardenReach GRSE are 2531.95 and 2592.95 | Daily Target 1 | 2518.63 | | Daily Target 2 | 2545.27 | | Daily Target 3 | 2579.6333333333 | | Daily Target 4 | 2606.27 | | Daily Target 5 | 2640.63 |
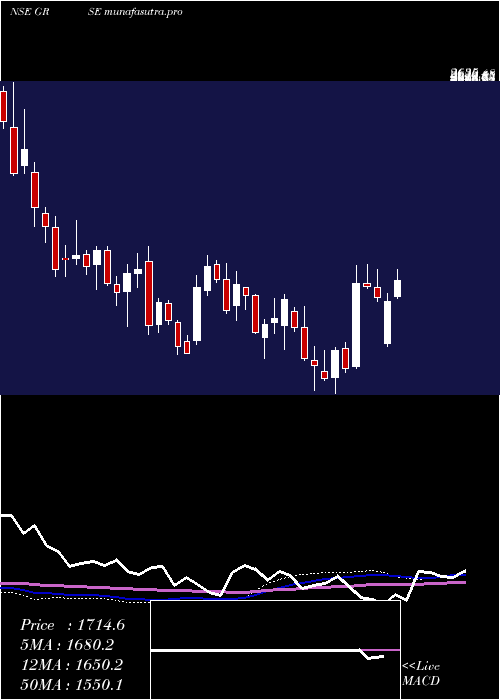
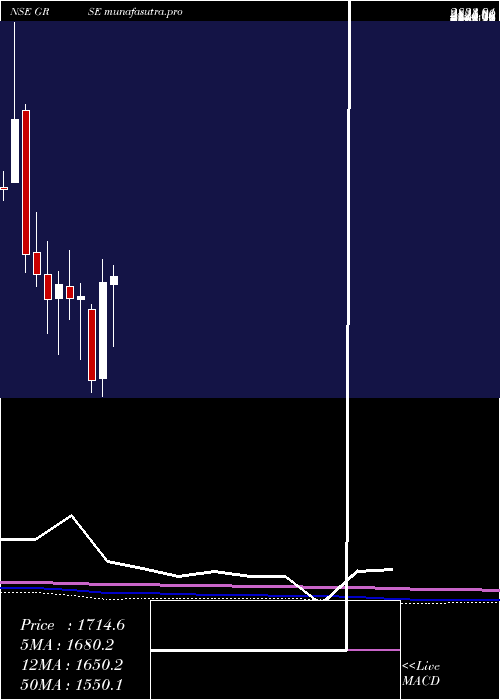
Daily price and volume Garden Reach
| Date |
Closing |
Open |
Range |
Volume |
Tue 28 October 2025 |
2571.90 (-0.08%) |
2589.00 |
2553.00 - 2614.00 |
0.8107 times |
Mon 27 October 2025 |
2573.90 (-1.44%) |
2614.00 |
2558.60 - 2618.50 |
0.9401 times |
Fri 24 October 2025 |
2611.60 (0.05%) |
2635.00 |
2604.00 - 2681.00 |
2.1722 times |
Thu 23 October 2025 |
2610.20 (-1.21%) |
2655.00 |
2603.50 - 2660.40 |
0.6516 times |
Tue 21 October 2025 |
2642.30 (0.2%) |
2644.00 |
2636.30 - 2654.90 |
0.2069 times |
Mon 20 October 2025 |
2637.00 (1.56%) |
2613.00 |
2598.00 - 2642.00 |
0.7992 times |
Fri 17 October 2025 |
2596.40 (-0.64%) |
2608.00 |
2590.00 - 2670.60 |
1.4365 times |
Thu 16 October 2025 |
2613.00 (-0.24%) |
2620.00 |
2590.10 - 2641.00 |
0.8268 times |
Wed 15 October 2025 |
2619.30 (2.22%) |
2567.60 |
2545.50 - 2637.00 |
1.2224 times |
Tue 14 October 2025 |
2562.40 (-1.66%) |
2618.00 |
2551.00 - 2629.90 |
0.9336 times |
Mon 13 October 2025 |
2605.60 (-2.05%) |
2657.10 |
2600.00 - 2657.10 |
0.8896 times |

Weekly price and charts GardenReach Strong weekly Stock price targets for GardenReach GRSE are 2529.7 and 2595.2 | Weekly Target 1 | 2515.63 | | Weekly Target 2 | 2543.77 | | Weekly Target 3 | 2581.1333333333 | | Weekly Target 4 | 2609.27 | | Weekly Target 5 | 2646.63 |
Weekly price and volumes for Garden Reach
| Date |
Closing |
Open |
Range |
Volume |
Tue 28 October 2025 |
2571.90 (-1.52%) |
2614.00 |
2553.00 - 2618.50 |
0.197 times |
Fri 24 October 2025 |
2611.60 (0.59%) |
2613.00 |
2598.00 - 2681.00 |
0.4309 times |
Fri 17 October 2025 |
2596.40 (-2.39%) |
2657.10 |
2545.50 - 2670.60 |
0.5973 times |
Fri 10 October 2025 |
2660.00 (-2.36%) |
2727.90 |
2653.10 - 2793.20 |
0.9045 times |
Fri 03 October 2025 |
2724.40 (4.32%) |
2630.00 |
2481.50 - 2746.00 |
1.2009 times |
Fri 26 September 2025 |
2611.50 (0.24%) |
2695.00 |
2605.00 - 2829.80 |
1.9016 times |
Fri 19 September 2025 |
2605.30 (0.91%) |
2574.00 |
2426.60 - 2727.00 |
2.6943 times |
Fri 12 September 2025 |
2581.90 (7.3%) |
2410.20 |
2350.00 - 2586.40 |
1.0283 times |
Fri 05 September 2025 |
2406.30 (2.32%) |
2360.00 |
2358.10 - 2589.00 |
0.6715 times |
Fri 29 August 2025 |
2351.70 (-7.88%) |
2580.10 |
2323.00 - 2614.80 |
0.3738 times |
Fri 22 August 2025 |
2552.80 (-1.36%) |
2629.90 |
2545.10 - 2718.00 |
0.5252 times |
Monthly price and charts GardenReach Strong monthly Stock price targets for GardenReach GRSE are 2543.9 and 2821.2 | Monthly Target 1 | 2349.7 | | Monthly Target 2 | 2460.8 | | Monthly Target 3 | 2627 | | Monthly Target 4 | 2738.1 | | Monthly Target 5 | 2904.3 |
Monthly price and volumes Garden Reach
| Date |
Closing |
Open |
Range |
Volume |
Tue 28 October 2025 |
2571.90 (1.69%) |
2530.00 |
2515.90 - 2793.20 |
0.4231 times |
Tue 30 September 2025 |
2529.10 (7.54%) |
2360.00 |
2350.00 - 2829.80 |
0.9933 times |
Fri 29 August 2025 |
2351.70 (-9.96%) |
2620.00 |
2323.00 - 2718.00 |
0.2997 times |
Thu 31 July 2025 |
2611.90 (-13.38%) |
3029.30 |
2423.10 - 3062.20 |
0.5178 times |
Mon 30 June 2025 |
3015.20 (0.4%) |
3000.00 |
2841.70 - 3538.40 |
1.6099 times |
Fri 30 May 2025 |
3003.20 (56.66%) |
1917.00 |
1741.20 - 3147.00 |
2.9341 times |
Wed 30 April 2025 |
1917.00 (13.72%) |
1680.00 |
1405.00 - 2044.50 |
1.296 times |
Fri 28 March 2025 |
1685.70 (34.21%) |
1262.70 |
1184.90 - 1790.00 |
1.0802 times |
Fri 28 February 2025 |
1256.00 (-22.67%) |
1568.00 |
1201.10 - 1590.00 |
0.5165 times |
Fri 31 January 2025 |
1624.20 (0.48%) |
1612.00 |
1350.00 - 1681.75 |
0.3295 times |
Tue 31 December 2024 |
1616.40 (-3.74%) |
1669.00 |
1525.15 - 1828.80 |
0.363 times |
DMA SMA EMA moving averages of Garden Reach GRSE
DMA (daily moving average) of Garden Reach GRSE
| DMA period | DMA value | | 5 day DMA | 2601.98 | | 12 day DMA | 2608.63 | | 20 day DMA | 2627.77 | | 35 day DMA | 2593.98 | | 50 day DMA | 2566.45 | | 100 day DMA | 2711.72 | | 150 day DMA | 2493.71 | | 200 day DMA | 2226.5 | EMA (exponential moving average) of Garden Reach GRSE
| EMA period | EMA current | EMA prev | EMA prev2 | | 5 day EMA | 2593.06 | 2603.64 | 2618.51 | | 12 day EMA | 2610 | 2616.93 | 2624.75 | | 20 day EMA | 2612.09 | 2616.32 | 2620.78 | | 35 day EMA | 2592.82 | 2594.05 | 2595.24 | | 50 day EMA | 2568.5 | 2568.36 | 2568.13 |
SMA (simple moving average) of Garden Reach GRSE
| SMA period | SMA current | SMA prev | SMA prev2 | | 5 day SMA | 2601.98 | 2615 | 2619.5 | | 12 day SMA | 2608.63 | 2621.14 | 2630.28 | | 20 day SMA | 2627.77 | 2629.75 | 2636.9 | | 35 day SMA | 2593.98 | 2589.25 | 2584.43 | | 50 day SMA | 2566.45 | 2567.79 | 2566.51 | | 100 day SMA | 2711.72 | 2719.57 | 2725.33 | | 150 day SMA | 2493.71 | 2487.5 | 2479.46 | | 200 day SMA | 2226.5 | 2221.31 | 2216.66 |
|
|
